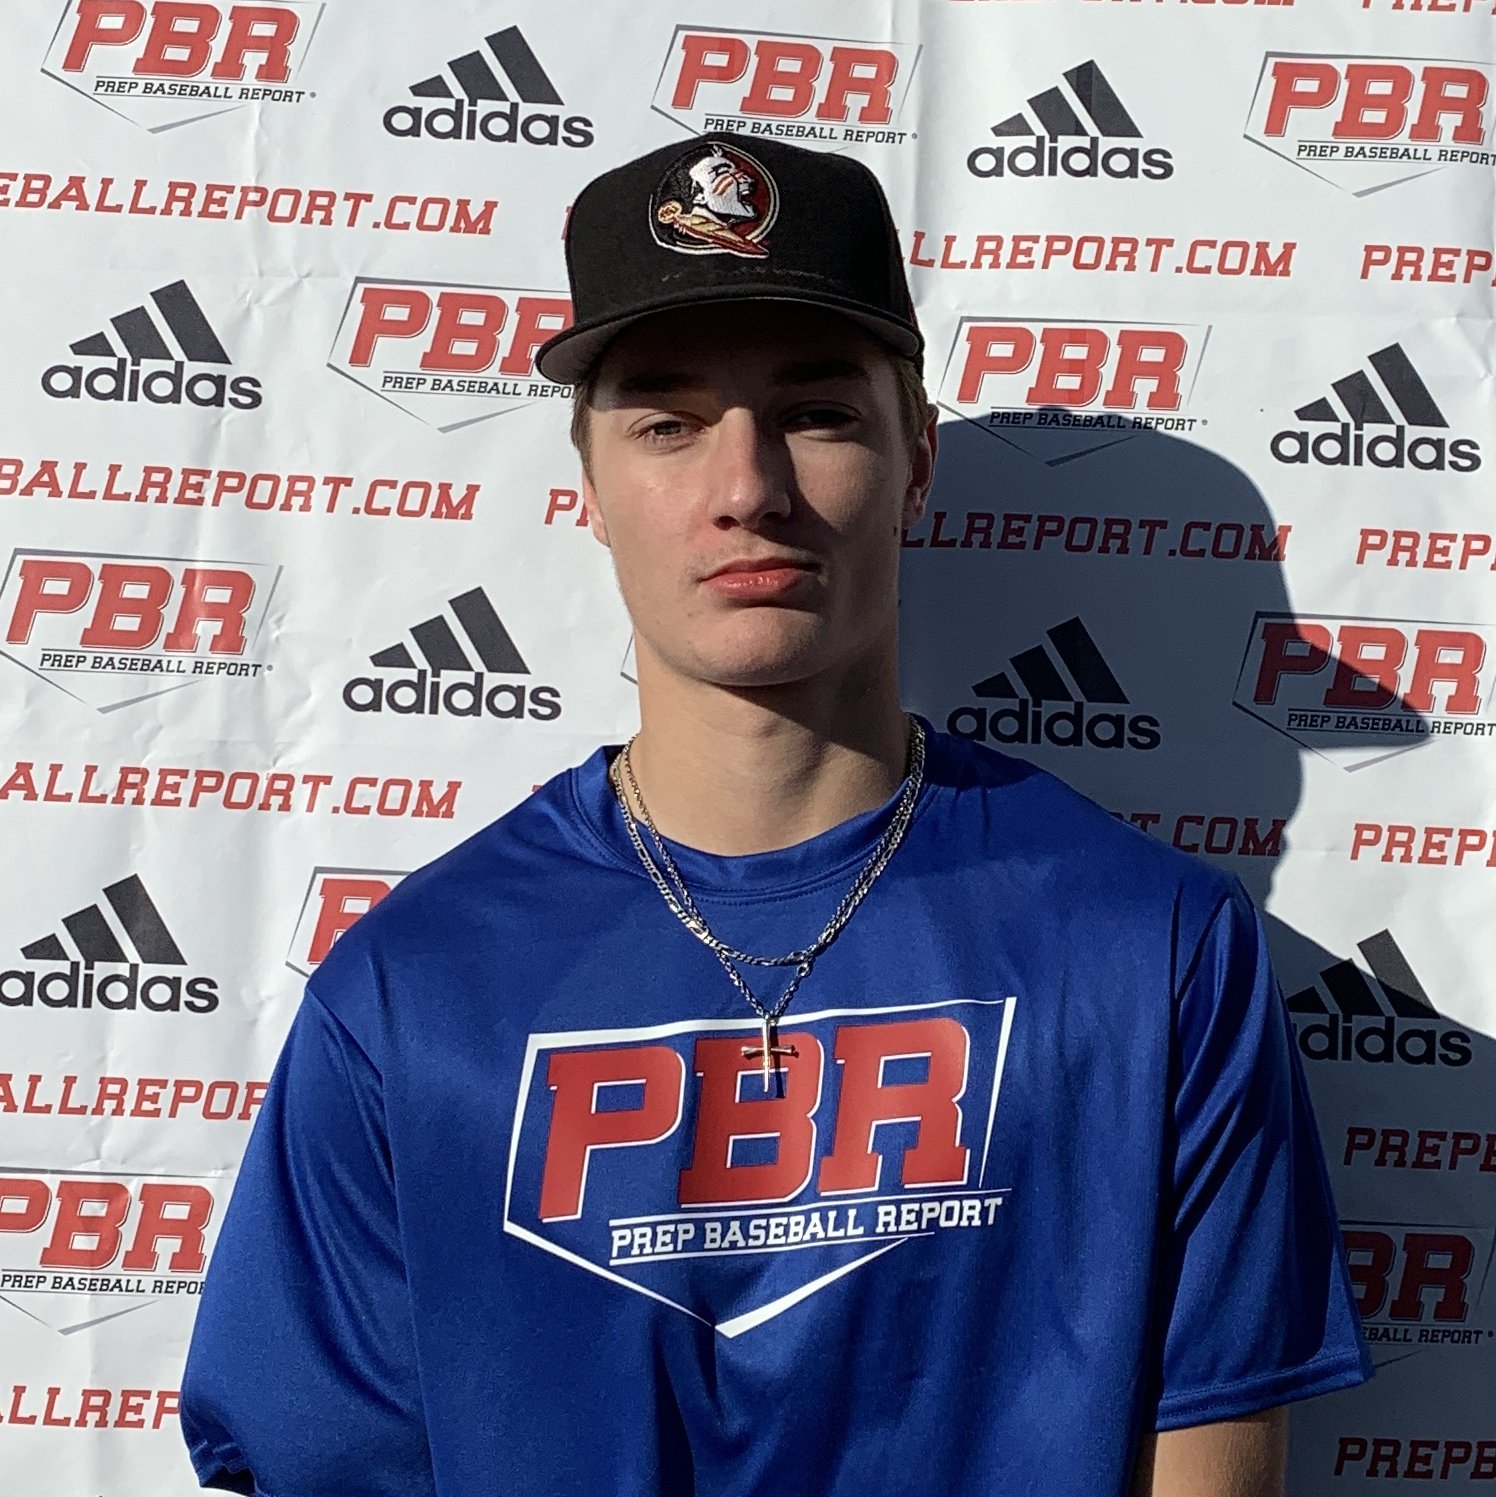
CLASS OF 2021
C
2B
Tyler
Herron
Parkland College
St. Albert Dev Program (HS) • AB
6' 1" • 190LBS
R/R • 21yr 5mo
Travel Team: St. Albert U18 AAA
St. Albert Dev Program (HS) • AB
6' 1" • 190LBS
R/R • 21yr 5mo
Travel Team: St. Albert U18 AAA
Rankings
2021 National
Rankings available to Premium Subscriber
2021 State
Rankings available to Premium Subscriber
Commitment
Best Of Stats
23
Hand Speed (max)
9/14/22
74.3
Bat Speed (max)
9/14/22
9.8
Rot. Acc (max)
9/14/22
83
Hard Hit %
9/14/22
97.6
Exit Velocity (max)
9/14/22
92.8
Exit Velocity (avg)
9/14/22
372
Distance (max)
9/14/22
75
Sweet Spot %
9/14/22
6.8
60
9/14/22
3.83
30-yd
9/14/22
1.67
10-yd
9/14/22
20.7
Run speed (max)
9/14/22
87
INF Velo
10/03/20
-
OF Velo
88
C Velo
9/14/22
1.84 - 1.92
Pop Time
10/03/20
Fastball
-
Velocity (max)
79 - 81
Velo Range
6/06/19
-
Spin Rate (avg)
Changeup
69 - 74
Velo Range
6/06/19
-
Spin Rate (avg)
Curveball
64 - 66
Velo Range
6/06/19
-
Spin Rate (avg)
Positional Tools
2022
2021
2020
2019
60 Yard Dash
The athlete's fastest 60-yard dash time in the given event year. Measured in seconds (s)
6.80
Pop Time
The athlete's fastest pop time in the given event year. Measured from glove to glove, in seconds (s).
1.96 - 2.13
Catcher Velocity
The athlete's maximum throwing velocity from the catcher position in the given event year. Measured in miles per hour (MPH).
88.0
Power / Speed Score
A simple calculation that divides the athlete’s Exit Velocity Max by the athlete’s 60 Yard Dash time for the given event year. For example, 98 MPH / 7.00s = 14.00.
14.3
60 Yard Dash
The athlete's fastest 60-yard dash time in the given event year. Measured in seconds (s)
6.82
Pop Time
The athlete's fastest pop time in the given event year. Measured from glove to glove, in seconds (s).
2.01 - 2.05
Catcher Velocity
The athlete's maximum throwing velocity from the catcher position in the given event year. Measured in miles per hour (MPH).
84.0
Power / Speed Score
A simple calculation that divides the athlete’s Exit Velocity Max by the athlete’s 60 Yard Dash time for the given event year. For example, 98 MPH / 7.00s = 14.00.
13.2
60 Yard Dash
The athlete's fastest 60-yard dash time in the given event year. Measured in seconds (s)
7.10
Pop Time
The athlete's fastest pop time in the given event year. Measured from glove to glove, in seconds (s).
1.84 - 1.92
Catcher Velocity
The athlete's maximum throwing velocity from the catcher position in the given event year. Measured in miles per hour (MPH).
81.0
Infield Velocity
The athlete's maximum throwing velocity from an infield position in the given event year. Measured in miles per hour (MPH).
87.0
Power / Speed Score
A simple calculation that divides the athlete’s Exit Velocity Max by the athlete’s 60 Yard Dash time for the given event year. For example, 98 MPH / 7.00s = 14.00.
12.3
Pop Time
The athlete's fastest pop time in the given event year. Measured from glove to glove, in seconds (s).
1.97 - 2.05
Catcher Velocity
The athlete's maximum throwing velocity from the catcher position in the given event year. Measured in miles per hour (MPH).
71.0
Hitting

2022
2021
Exit Velocity Max
The highest exit velocity of any batted ball in the given event year. Measured in miles per hour (MPH).
97.6
Exit Velocity Avg
Average exit velocity of all batted balls in the given event year. Measured in miles per hour (MPH).
92.8
Distance Max
The highest flight distance of any batted ball in the given event year. Measured in feet (ft).
372
Distance Avg
Average flight distance of all batted balls in the given event year. Measured in feet (ft).
244
Launch Angle Avg
Average launch angle of all batted balls in the given event year. Measured in degrees.
21.2
Hard Hit %
Percentage of batted balls with exit velocities over 95 MPH in the given event year.
Sweet Spot %
Percentage of batted balls in the given event year with a launch angle between 8° and 32°.
Line Drive %
Percentage of batted balls with launch angles between 10 and 25 degrees in the given event year.
Fly Ball %
Percentage of batted balls with launch angles between 25 and 50 degrees in the given event year.
Ground Ball %
Percentage of batted balls with launch angles below 10 degrees in the given event year.
Exit Velocity Max
The highest exit velocity of any batted ball in the given event year. Measured in miles per hour (MPH).
90.0
Exit Velocity Avg
Average exit velocity of all batted balls in the given event year. Measured in miles per hour (MPH).
84.4
Distance Max
The highest flight distance of any batted ball in the given event year. Measured in feet (ft).
344
Distance Avg
Average flight distance of all batted balls in the given event year. Measured in feet (ft).
260
Launch Angle Avg
Average launch angle of all batted balls in the given event year. Measured in degrees.
24.9
Hard Hit %
Percentage of batted balls with exit velocities over 95 MPH in the given event year.
Sweet Spot %
Percentage of batted balls in the given event year with a launch angle between 8° and 32°.
Line Drive %
Percentage of batted balls with launch angles between 10 and 25 degrees in the given event year.
Fly Ball %
Percentage of batted balls with launch angles between 25 and 50 degrees in the given event year.
Ground Ball %
Percentage of batted balls with launch angles below 10 degrees in the given event year.
PBR IL: Parkland JC Scout Day
Sep 14, 2022
Trackman - Hitting
97.6
Exit Velocity (max)
92.8
Exit Velocity (avg)
244
Distance (avg)
372
Distance (max)
Hard Hit %
Sweet Spot %
Line Drive %
Fly Ball %
Ground Ball %
PBR IL: Parkland JC Scout Day
Sep 1, 2021
Trackman - Hitting
90.0
Exit Velocity (max)
84.4
Exit Velocity (avg)
260
Distance (avg)
344
Distance (max)
Sweet Spot %
Line Drive %
Fly Ball %
Ground Ball %
Hitting

2022
2021
Hand Speed Max
The highest Peak Hand Speed of any swing in the given event year.
23.0
Hand Speed Avg
The average Peak Hand Speed for all swings in the given event year.
20.7
Bat Speed Max
The highest Bat Speed of any swing in the given event year.
74.3
Bat Speed Avg
The average Bat Speed for all swings in the given event year.
71.5
Rotational Acceleration Max
The highest Rotational Acceleration of any swing in the given event year.
Rotational Acceleration Avg
The average Rotational Acceleration for all swings in the given event year.
On-Plane Efficiency Max
The highest On-Plane Efficiency of any swing in the given event year.
On-Plane Efficiency Avg
The average On-Plane Efficiency for all swings in the given event year.
Hand Speed Max
The highest Peak Hand Speed of any swing in the given event year.
21.3
Hand Speed Avg
The average Peak Hand Speed for all swings in the given event year.
20.2
Bat Speed Max
The highest Bat Speed of any swing in the given event year.
72.1
Bat Speed Avg
The average Bat Speed for all swings in the given event year.
70.6
Rotational Acceleration Max
The highest Rotational Acceleration of any swing in the given event year.
Rotational Acceleration Avg
The average Rotational Acceleration for all swings in the given event year.
On-Plane Efficiency Max
The highest On-Plane Efficiency of any swing in the given event year.
On-Plane Efficiency Avg
The average On-Plane Efficiency for all swings in the given event year.
PBR IL: Parkland JC Scout Day
Sep 14, 2022
Blast - Hitting
23.0
Hand Speed (max)
20.7
Hand Speed (avg)
74.3
Bat Speed (max)
71.5
Bat Speed (avg)
Rot. Acc (max)
Rot. Acc (avg)
On Plane Eff (avg)
MaxOnPlaneEfficiency
PBR IL: Parkland JC Scout Day
Sep 1, 2021
Blast - Hitting
21.3
Hand Speed (max)
20.2
Hand Speed (avg)
72.1
Bat Speed (max)
70.6
Bat Speed (avg)
Rot. Acc (max)
Rot. Acc (avg)
On Plane Eff (avg)
MaxOnPlaneEfficiency
Pitching

Pitch Scores
Pitching Velos
2019
Fastball
Velocity Avg
The average velocity for all pitches of this type in the given event year. Measured in miles per hour (MPH)
80.0
Curveball
Velocity Avg
The average velocity for all pitches of this type in the given event year. Measured in miles per hour (MPH)
65.0
Changeup
Velocity Avg
The average velocity for all pitches of this type in the given event year. Measured in miles per hour (MPH)
71.5
Game Performance

2022
10 Yard Dash
The athlete's fastest 0-10-yard split time in the given event year. Measured in seconds.
1.68
30 Yard Dash
The athlete's fastest 0-30-yard split time in the given event year. Measured in seconds.
3.83
60 Yard Dash
The athlete's fastest 0-60-yard time in the given event year. Measured in seconds.
6.80
Top Speed (MPH)
The athlete's fastest split time converted to miles per hour.
Visual Edge

Pitch Ai

Notes
News
- PBR JUCO: Top 150 Prospects - Jan 2, 2023
- PBR IL: Parkland JC Scout Day: Takeaways - Sep 16, 2022
- PBR IL: Parkland JC Scout Day: Data Dive - Sep 16, 2022
- Puma Classic 2022: Quick Hits- Position Players - Sep 12, 2022
- Best of 2021: JUCO Max Catcher Velocity Leaders - Dec 16, 2021
- Best of 2021: JUCO 60-Yard Dash Leaders - Dec 9, 2021
- PBR JUCO Wire Scout Day Leaders: Position Players - Oct 4, 2021
- Puma Classic Standouts - Sep 14, 2021
- 2021 Watch: Hitters To Watch This Year - Feb 16, 2021
- 2021 Alberta Rankings - Updated and Expanded - Jan 21, 2021
- 2021s On The Rise - Nov 18, 2020
- Results From 2020 Edmonton Open ID - Oct 14, 2020
- 2020 Edmonton Open ID - Top Performers - Oct 14, 2020
- 2019 Edmonton Showcase - Top Performers - Jul 8, 2019
- 2019 Edmonton Showcase - Sneak Peek - Jul 8, 2019
Comments
Draft Reports
Contact
Premium Content Area
To unlock contact information, you need to purchase a ScoutPLUS subscription.
Purchase Subscription OR
Login


 Sign in to view rankings
Formerly the No. 7 ranked prospect in the Alberta 2021 class. Athletic backstop with plus-plus arm strength, reaching up to 88 mph from the chute with carry. Transfer is raw and long, but arm strength is obvious. Most throws sailed into center field on this look, but were much more accurate during game action at the Puma Classic last weekend. At the plate, the right-handed hitter consistently produced line drives with a top hand dominant swing. He showed better pop to his pull-side in batting practice, reaching up to 97.6 mph for a max exit velocity with a max distance of 371’. His speed is above-average as well, running to a 6.80 in the 60-yard dash. Overall, looks to have all the tools, just needs polish with how he gets to them.
2022 Puma Classic: Created some scouting buzz with a plus arm and on the money throws from behind the dish. Brings good energy. At the plate he produced three base hits, one for extras. Also runs well.
Listed at 6-feet, 155-pounds. The uncommitted 2021 has quietly emerged as one of the top 2021 prospects in Alberta. Behind the dish, he is fundamentally sound, creates good angles when blocking, moves side to side well, quick and athletic actions, soft hands, arm strength is there from the crouch. Herron was a standout at the plate as well during the Edmonton showcase, showed a very good gap to gap approach from the right side, good pitch recognition and does not try to do too much. Line drive swing with potential to add power as he continues to grow and add strength to current frame.
On the mound, Herron showed a good three pitch mix with a fastball in the low 80's, a breaking ball he was able to throw for strikes consistently along with a changeup with good arm side run. Quick arm with a short path and good extension when finishing.