Trackman Stories: Total Movement and Movement Separation
February 5, 2021

PBR Arizona held its Preseason All-State Games 1/30-1/31 at Arcadia Ridge High School in Phoenix, AZ. The event was divided into two separate days, Upperclass (2021-2022 grads) & Underclass (2023-2025 grads). This event featured over 150 prospects in total from all across the state of Arizona with a few players trickling in from border states and even Hawaii.
Before we roll into the weekend, lets take a look back at some of the data we collected at the Arizona Preseason All-State Games. First off, we will take a look at some of data Trackman helped us gather on the mound where 65 pitchers in total toed the rubber.
Total Movement
The first metric to we will look at is Total Movement. Although not a true Trackman metric itself. Total Movement can be inferred using Induced Vertical Break and Horizontal Break from the Trackman data collected at the games. Below is an edited depiction of a pitch's movement given by Trackman.
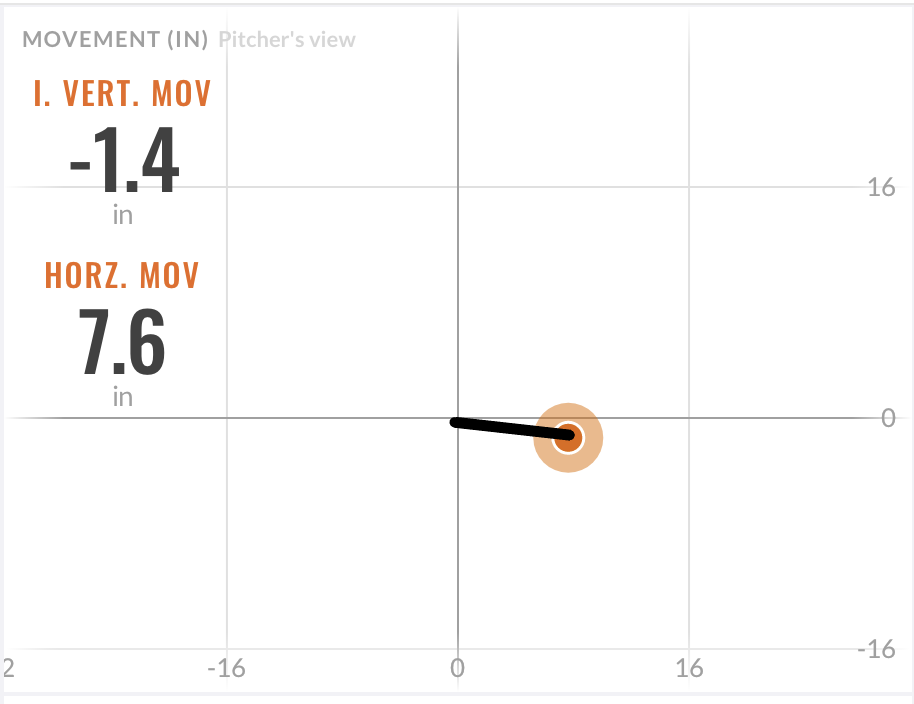
The orange dot on the grid there is the pitch itself. It registered 7.6 inches of horizontal movement and -1.4 inches of vertical movement. The black line that goes from the orange dot back to the 0,0 point is what Total Movement represents. How far did this pitch move compared to a pitch with 0 vertical inches and 0 horizontal inches of movement. Do a little bit of math and this pitch turns out to have 7.7 inches of Total Movement. With that being said, lets look at the Top-5 in Total Movement by pitch-type!
UpperClass
Fastballs |
Curveballs |
||
Name |
Avg Total Movement |
Name |
|
Jackson Brenna |
24.78 |
Jace Smith |
20.22 |
Shaun Cottrell |
23.19 |
Benjamin Cazares |
18.82 |
David Sobeck |
23.19 |
Drew Gilbert |
18.36 |
Stephen Hernandez |
22.40 |
Steven Vasquez |
14.64 |
Benjamin Cazares |
22.33 |
Stephen Hernandez |
13.82 |
Sliders |
Change-Ups |
||
Name |
Total Movement |
Name |
|
Jack Minhinnick |
14.09 |
Tommy La Porte |
23.30 |
Brandon Koble |
14.00 |
Jack Minhinnick |
21.08 |
Ayden Sauerbrei |
11.40 |
Ayden Sauerbrei |
19.35 |
Jackson Brenna |
10.61 |
Ethan Hatch |
14.39 |
David Sobeck |
8.83 |
Antonio Mejia |
14.27 |
Underclass
Fastball |
Curveballs |
||
Name |
Total Movement |
Name |
Total Movement |
David Galindo |
22.57 |
Smith Bailey |
20.83 |
Wryker House |
21.66 |
Noah Andersen |
18.83 |
Noah Scilley |
21.08 |
Dallin Harrison |
17.91 |
Andrew Griffin |
20.58 |
Dillon Roberts |
17.21 |
Justin Chambers |
20.57 |
Andrew Griffin |
16.36 |
Sliders |
Change-Ups |
||
Name |
Total Movement |
Name |
Total Movement |
Matthew Hart |
19.57 |
Aidan Yancy |
14.05 |
Dillon Roberts |
11.21 |
Austin Kalsek |
16.83 |
| Landon Turnage | 8.63 |
Declan Conry |
15.18 |
Wryker House |
6.81 |
||
Matthew Storck |
6.05 |
||
Movement Separation
The next metric to look over is Movement Separation. Another non-Trackman data point that can be created using the Trackman data. Similar to Total Movement, Movement Separation is the movement of a pitch off of the pitcher's fastball. Another diagram below:
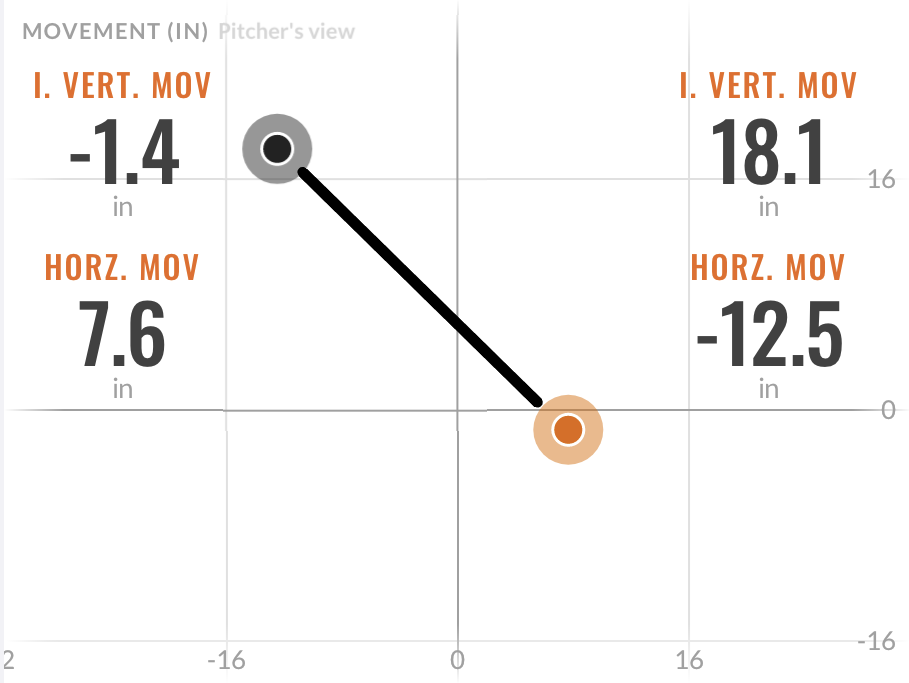
The black dot in the upper left is an example fastball with 18.1 inches of Vertical Movement and -12.5 inches of Horizontal Movement. The orange dot is that same pitch we used above in the first example. Now instead of taking the distance to pitch with no movement, we use the fastball as the reference point. Therefore, this set would have a Movement Separation of 28.0 inches. Below are the Top-5 in Movement Separation for Sliders and Curveballs.
Fastball vs. Slider |
Fastball vs. Curveball |
||
Name |
Separation |
Name |
Separation |
Adian Duarte |
32.87 |
Shaun Cottrell |
41.47 |
Jack Minhinnick |
31.47 |
Cody Albright |
39.93 |
Brandon Koble |
30.02 |
Jace Smith |
39.29 |
Ethan Hatch |
27.74 |
Benjamin Cazares |
39.04 |
Jackson Brenna |
26.56 |
Albert Roblez |
36.77 |
Underclass
Fastballs vs. Sliders |
Fastballs vs. Curveballs |
||
Name |
Separation |
Name |
|
Matthew Hart |
35.17 |
David Galindo |
41.15 |
Erick Dessens |
20.09 |
Austin Kalsek |
39.52 |
Matthew Storck |
18.85 |
Smith Bailey |
38.65 |
Landon Turnage |
17.41 |
Wyatt Halvorson |
38.45 |
Wryker House |
16.22 |
Noah Andersen |
36.53 |
For full charts click here!