Prep Baseball Report

California State Games: Blast Leaderboard


PBR California Staff

New Episode LIVE now! At The Yard Podcast

Orange, CALIF. - We will roll out more content from the California State Games, including Quick Hits in the coming days, and until then, today it's the Blast Motion leaderboard, displaying the top swing metric leaders from a group of very talented players, many of whom are uncommitted.

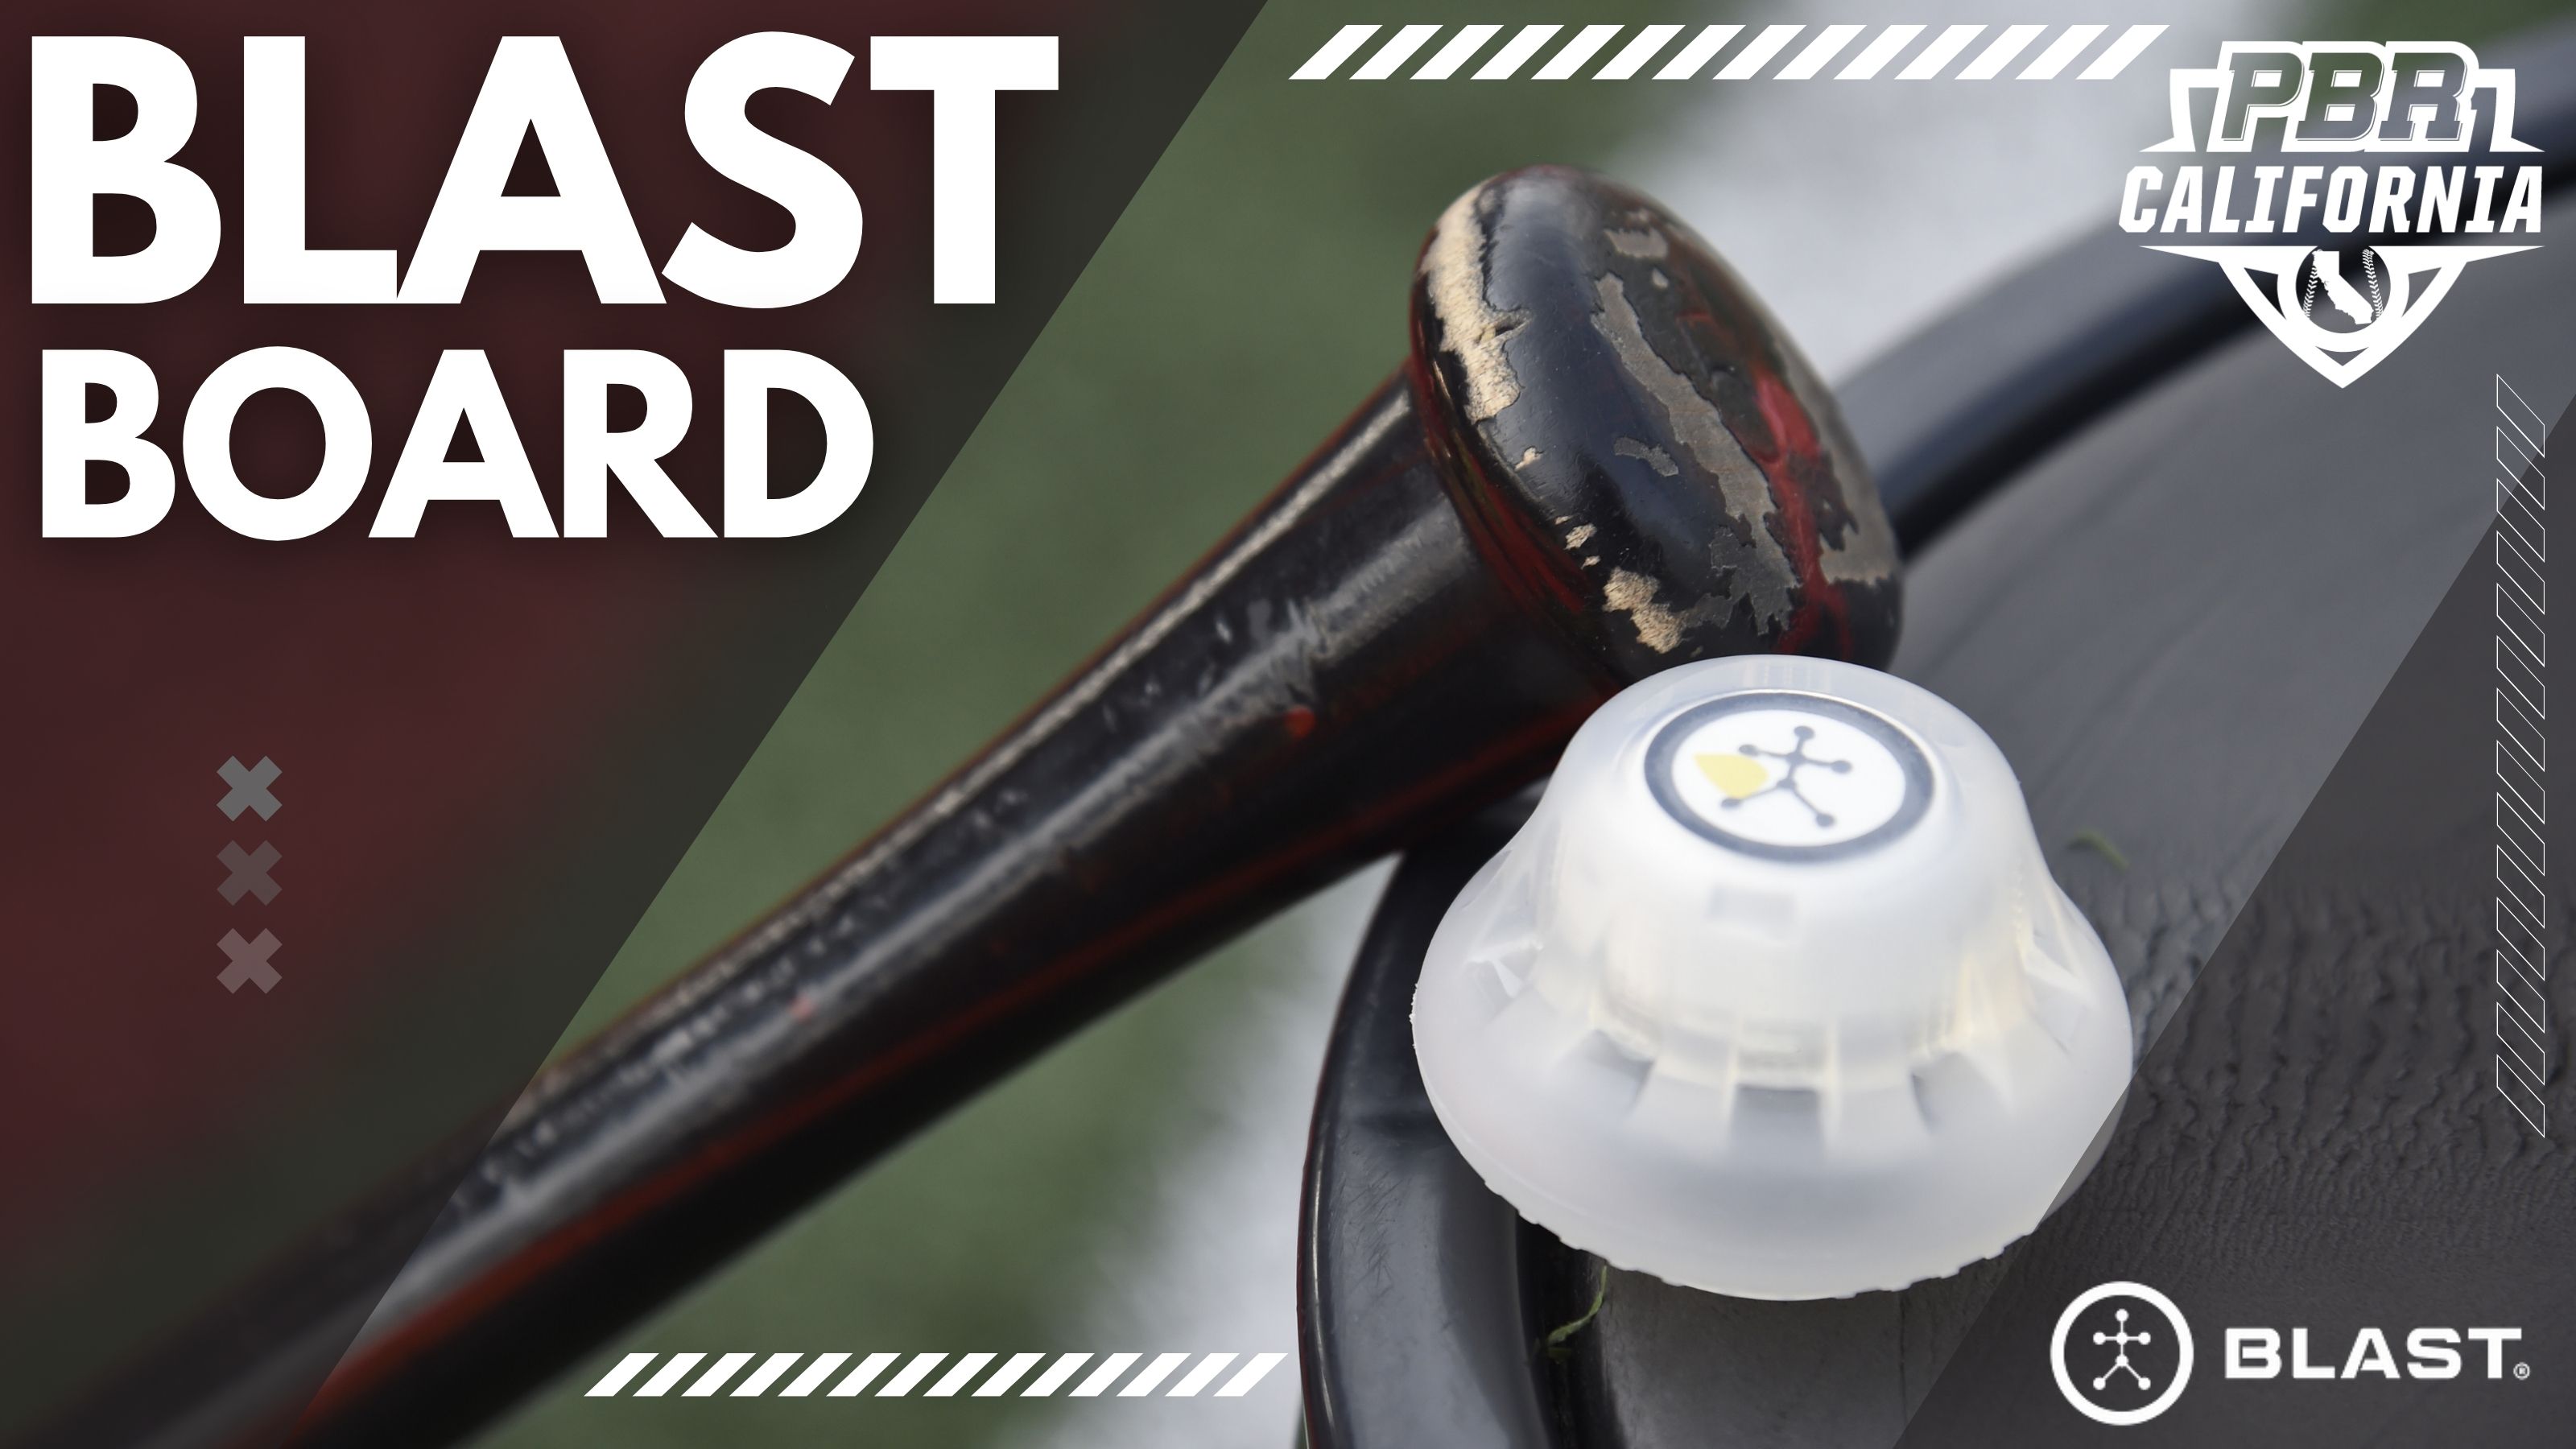
One of the important tools Prep Baseball Report has implemented at its events is the use of Blast Motion sensors. During batting practice, the Blast Motion sensors measure Swing and Impact Metrics across several categories. Swing metrics measure pre-impact mechanics centered around plane, connection, and rotation while impact metrics measure pre-impact performance outcomes based on ball contact.

With the Blast Motion sensor, we were able to collect data from each swing taken by each prospect at the event. The metrics collected include: Bat Speed, On Plane Efficiency, Peak Hand Speed, and Rotational Acceleration. 

Each player has their Blast Motion metrics uploaded into their profiles following the completion of the event providing insight into areas that could be improved upon as well as helping paint a clear picture of the player to the college and professional scouts doing their research on prospects they may be interested in.

BLAST LEADERS

Max Bat Speed

Bat Speed is the observed speed of the sweet spot of the bat at impact. For more info: Blast Bat Speed 

MLB Avg: 66-78 mph | MiLB: 63-75 mph | College: 66-75 mph

Rank Name State School Class Pos Bat Speed (max)
1 River Diaz De Leon CA Grossmont 2023 OF 84.1 mph
2 Ryan Prescott CA Buena Park 2024 1B 83.9 mph
3 Matthew Thomas CA Cypress 2023 OF 77.9 mph
4 Dean Carpentier CA Huntington Beach 2023 SS 77.5 mph
5 Luke Matlock CA Cypress 2023 2B 77.1 mph
6 Cameron Taylor CA Napa 2023 3B 76.8 mph
7 Logan Freeborn CA Santa Margarita Catholic 2025 OF 75.3 mph
8 Brian Trujillo CA Huntington Beach 2023 2B 75.1 mph
9 AJ Guiliana CA Torrey Pines 2023 SS 74.0 mph
10 Hunter Backstrom CA Junipero Serra 2023 OF 73.9 mph
11 Daniel Paul CA Bella Vista 2023 OF 73.8 mph
12 Addison Klepsch CA Del Norte 2024 SS 73.6 mph
13 Zachary Armenta CA Rancho San Juan 2023 1B 73.5 mph
^ Dominic Puentes CA Kerman 2023 SS 73.5 mph
14 Lucas Schumaker CA Serra 2024 OF 73.3 mph
15 Nate Cena CA Christian 2023 OF 73.1 mph
16 Gregory Rangel CA Chaminade Prep 2024 OF 73.0 mph
17 Sam Young CA Crystal Springs Uplands 2024 3B 72.7 mph
18 Maximo Martinez CA Mira Costa 2024 SS 72.3 mph
19 Ethan Nunez CA Ayala 2023 OF 72.0 mph
20 Tyler Allen CA Whitney 2023 OF 71.7 mph
^ Matthew Churchill CA Chaminade 2024 C 71.7 mph

Average Bat Speed

Rank Name State School Class Pos Bat Speed (avg)
1 Ryan Prescott CA Buena Park 2024 1B 78.2 mph
2 River Diaz De Leon CA Grossmont 2023 OF 75.6 mph
3 Luke Matlock CA Cypress 2023 2B 74.2 mph
4 Matthew Thomas CA Cypress 2023 OF 74.0 mph
5 Logan Freeborn CA Santa Margarita Catholic 2025 OF 72.5 mph
6 Dean Carpentier CA Huntington Beach 2023 SS 72.0 mph
7 Cameron Taylor CA Napa 2023 3B 71.4 mph
8 Daniel Paul CA Bella Vista 2023 OF 71.2 mph
9 AJ Guiliana CA Torrey Pines 2023 SS 71.1 mph
10 Dominic Puentes CA Kerman 2023 SS 71.1 mph
11 Hunter Backstrom CA Junipero Serra 2023 OF 70.9 mph
12 Maximo Martinez CA Mira Costa 2024 SS 70.3 mph
13 Addison Klepsch CA Del Norte 2024 SS 70.3 mph
14 Sam Young CA Crystal Springs Uplands 2024 3B 69.7 mph
15 Ethan Nunez CA Ayala 2023 OF 69.7 mph
16 Tyler Allen CA Whitney 2023 OF 69.7 mph
17 Lucas Schumaker CA Serra 2024 OF 69.6 mph
18 Zachary Armenta CA Rancho San Juan 2023 1B 69.6 mph
19 Marshall Minor CA Beckman 2023 OF 68.8 mph
20 Gregory Rangel CA Chaminade Prep 2024 OF 68.1 mph

On Plane Efficiency

Measures the percentage of your swing where the bat is on the swing plane. Your vertical bat angle at contact establishes the plane for that swing. Plane is a great indicator for making more consistent contact on the barrel of the bat. For more info: On Plane Efficiency

Ideal Efficiency %: 70% or Higher | Range: 65%-85%

Rank Name State School Class Pos On Plane Eff (avg)
1 AJ Guiliana CA Torrey Pines 2023 SS 82 %
2 Gavin Egan CA Aquinas 2025 OF 81 %
3 Christopher DiPrima CA Del Norte 2023 RHP 79 %
4 Matthew Churchill CA Chaminade 2024 C 78 %
5 Gregory Rangel CA Chaminade Prep 2024 OF 74 %
6 Benjamin Reiland CA Orange Lutheran 2024 SS 74 %
^ Addison Klepsch CA Del Norte 2024 SS 74 %
7 Carson Cleage CA Menlo 2023 OF 73 %
8 Nathan D'Acquisto CA Poway 2025 C 73 %
9 Brian Trujillo CA Huntington Beach 2023 2B 72 %
10 Cade Goldstein CA Harvard-Westlake 2025 C 71 %
11 Tyler Shulman CA Calabasas 2023 SS 71 %
12 Mason McFadden CA Anderson 2025 C 71 %
13 Michael Perazzo CA Serra 2024 MIF 71 %
14 Henry Armstrong CA The Bishop's School 2025 C 71 %
15 Marshall Minor CA Beckman 2023 OF 70 %
16 Dylan Hillman CA Monte Vista 2024 SS 70 %
17 Luke Matlock CA Cypress 2023 2B 69 %
18 Andrew Parker CA Foothill 2023 RHP 69 %
19 Ethan Tsui CA Jesuit 2023 C 69 %
20 Dominic Puentes CA Kerman 2023 SS 67 %

Peak Hand Speed

Peak Hand Speed is the observed maximum speed as measured on the handle of the bat (measured six inches from the knob of the bat). Peak Hand Speed will occur prior to the moment of impact, very close to the commit time in the swing when the wrists unhinge. For more info: Peak Hand Speed

MLB Avg: 23-29 mph | MiLB Avg: 22-28 mph | College Avg: 21-24 mph

Rank Name State School Class Pos Hand Speed (max)
1 Dean Carpentier CA Huntington Beach 2023 SS 25.0 mph
2 Daniel Paul CA Bella Vista 2023 OF 24.3 mph
3 Owen Eisen CA Ocean View 2023 RHP 24.1 mph
4 Gregory Rangel CA Chaminade Prep 2024 OF 24.0 mph
5 Brian Trujillo CA Huntington Beach 2023 2B 23.8 mph
6 Cade Goldstein CA Harvard-Westlake 2025 C 23.5 mph
^ Hunter Backstrom CA Junipero Serra 2023 OF 23.5 mph
^ Matthew Thomas CA Cypress 2023 OF 23.5 mph
7 Zachary Armenta CA Rancho San Juan 2023 1B 23.4 mph
^ Ryan Prescott CA Buena Park 2024 1B 23.4 mph
8 Luke Matlock CA Cypress 2023 2B 23.1 mph
^ Dominic Puentes CA Kerman 2023 SS 23.1 mph
9 Addison Klepsch CA Del Norte 2024 SS 23.0 mph
^ Carson Cleage CA Menlo 2023 OF 23.0 mph
10 Owen Rice CA Quartz Hill 2024 SS 22.7 mph
^ Nate Cena CA Christian 2023 OF 22.7 mph
11 Ethan Nunez CA Ayala 2023 OF 22.6 mph
12 Christopher DiPrima CA Del Norte 2023 RHP 22.4 mph
^ Nathan D'Acquisto CA Poway 2025 C 22.4 mph
13 Cameron Taylor CA Napa 2023 3B 22.3 mph
^ Fernando Palencia CA Arcadia 2024 SS 22.3 mph
14 Matthew Churchill CA Chaminade 2024 C 21.9 mph
^ Kenny Winters CA Lincoln 2024 SS 21.9 mph
15 Xander Iniguez CA Eastlake 2024 C 21.8 mph
^ Sam Young CA Crystal Springs Uplands 2024 3B 21.8 mph

Average Peak Hand Speed

Rank Name State School Class Pos Hand Speed (avg)
1 Dean Carpentier CA Huntington Beach 2023 SS 24.1 mph
2 Owen Eisen CA Ocean View 2023 RHP 23.4 mph
3 Daniel Paul CA Bella Vista 2023 OF 23.1 mph
4 Gregory Rangel CA Chaminade Prep 2024 OF 22.8 mph
5 Brian Trujillo CA Huntington Beach 2023 2B 22.7 mph
6 Hunter Backstrom CA Junipero Serra 2023 OF 22.7 mph
7 Ryan Prescott CA Buena Park 2024 1B 22.5 mph
8 Cade Goldstein CA Harvard-Westlake 2025 C 22.3 mph
9 Luke Matlock CA Cypress 2023 2B 22.1 mph
10 Carson Cleage CA Menlo 2023 OF 22.0 mph
11 Owen Rice CA Quartz Hill 2024 SS 21.9 mph
12 Ethan Nunez CA Ayala 2023 OF 21.8 mph
13 Matthew Thomas CA Cypress 2023 OF 21.6 mph
14 Dominic Puentes CA Kerman 2023 SS 21.5 mph
15 Zachary Armenta CA Rancho San Juan 2023 1B 21.5 mph

Rotational Acceleration

Measures how quickly your bat accelerates into the swing plane. Rotation is a good indicator of how you build bat speed by sequencing properly. The quicker your rotational acceleration, the more power you will have and the more time you have to adjust to pitch locations. For more info: Rotational Acceleration

MLB Avg: 16.8 g | MiLB Avg: 12.6 g | College Avg: 12.9 g

Rank Name State School Class Pos Rot. Acc (avg)
1 Cade Goldstein CA Harvard-Westlake 2025 C 27.0 g
2 Daniel Paul CA Bella Vista 2023 OF 21.7 g
3 Brian Trujillo CA Huntington Beach 2023 2B 20.5 g
4 Ryan Prescott CA Buena Park 2024 1B 20.1 g
5 Nate Cena CA Christian 2023 OF 19.7 g
6 Mason McFadden CA Anderson 2025 C 19.3 g
7 Dean Carpentier CA Huntington Beach 2023 SS 19.1 g
8 Benjamin Reiland CA Orange Lutheran 2024 SS 18.8 g
9 Hunter Backstrom CA Junipero Serra 2023 OF 18.7 g
10 Luke Matlock CA Cypress 2023 2B 18.6 g
11 Owen Rice CA Quartz Hill 2024 SS 18.2 g
12 Cameron Taylor CA Napa 2023 3B 17.9 g
13 Christopher DiPrima CA Del Norte 2023 RHP 17.1 g
14 Gregory Rangel CA Chaminade Prep 2024 OF 17.0 g
15 Addison Klepsch CA Del Norte 2024 SS 16.9 g
16 Gavin Egan CA Aquinas 2025 OF 16.9 g
17 Henry Armstrong CA The Bishop's School 2025 C 16.1 g
18 Matthew Thomas CA Cypress 2023 OF 14.8 g
19 Carson Cleage CA Menlo 2023 OF 14.8 g
20 Matt Pueschel CA La Costa Canyon 2023 2B 14.6 g

UPCOMING EVENTS

SHOWCASE STATE DATE LOCATION
West Coast Games NV 08/12-08/14 UNLV/CCSN
SoCal Underclass Game CA 09/24 U of San Diego
SoCal Top Prospects Games CA 10/09 Great Park Stadium (Irvine)


RELATED TOPICS