Prep Baseball Report

SC Preseason All-State North: Trackman Hitting Leaders


Sammy Esposito
PBR SC Director of Scouting

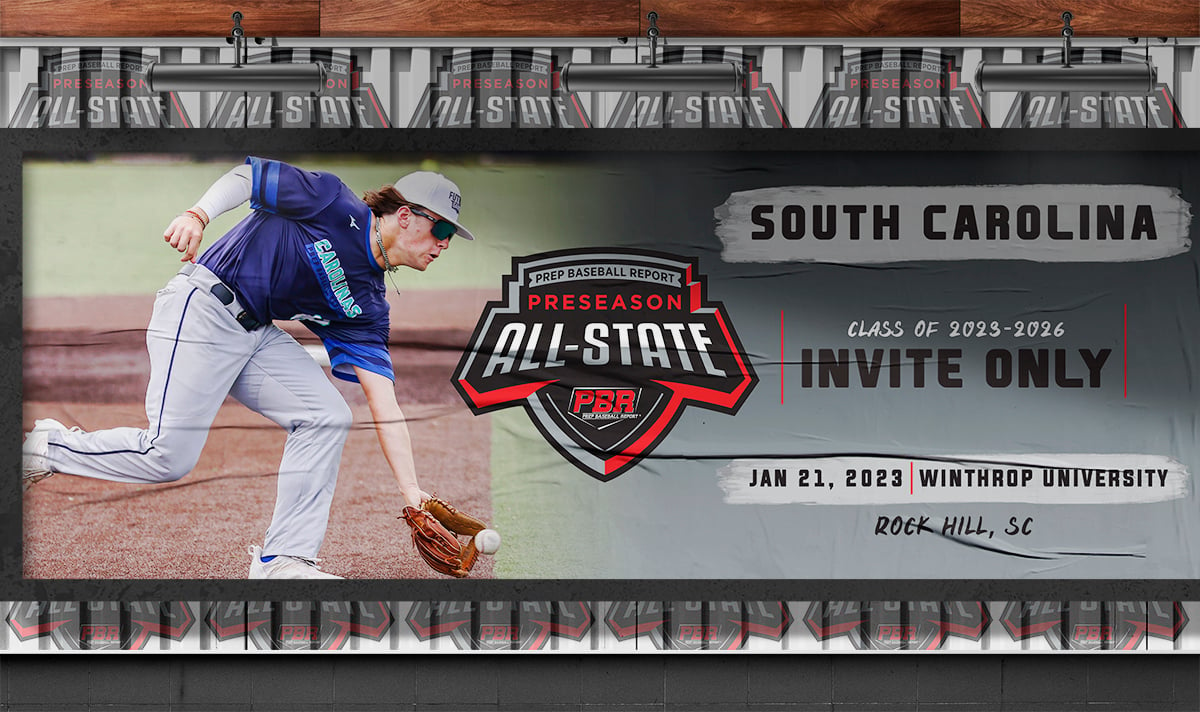
On Saturday January 21st PBR of South Carolina was on hand at The Winthrop Ball Park for our Preseason All-State North Event. The event featured players from the 2023-2028 grad classes.

The day started with BP on the field with Trackman collecting ball flight data followed the defensive evaluations followed by laser timed 60.  Then pitchers throwing a controlled bullpen with Trackman collecting data analytics  to finish the day.

Below we begin our breakdown of the players in attendance. 

Click Here for full roster and stats

Statistical Leaders
PEAK EXIT VELOCITY

TrackMan is able to track every ball hit into fair territory, throughout the BP sessions.  Below are the exit velocities produced by individual players.

Rank Name State School Class Pos Exit Velocity (max)
1 Gunner Jordan SC Cheraw 2024 1B 99.7 mph
2 Mitch Wilson SC Dorman 2024 C 99.1 mph
3 Chancellor Jennings SC Gilbert 2023 OF 98.8 mph
4 Lane McGaha SC Belton Honea Path 2024 1B 98.1 mph
5 Chas Welch SC Dorman 2023 OF 96.4 mph
6 BJ Jeter SC Union County 2024 OF 96.1 mph
7 Jack Coletti SC Chapin 2024 2B 93.5 mph
8 Tyler Rosario SC Legion Collegiate 2024 3B 93.3 mph
9 Reid Baxley SC Johnsonville 2024 2B 92.9 mph
10 Andrew Sands SC Northwestern 2024 C 92.5 mph


AVERAGE EXIT VELOCITY

The average exit velocity measures a players ability to consistently produce hard contact.  The average was taken based on every ball tracked by TrackMan throughout the player's BP session.

Rank Name State School Class Pos Exit Velocity (avg)
1 Chancellor Jennings SC Gilbert 2023 OF 93.5 mph
2 Mitch Wilson SC Dorman 2024 C 93.5 mph
3 Lane McGaha SC Belton Honea Path 2024 1B 92.1 mph
4 Chas Welch SC Dorman 2023 OF 90.5 mph
5 Andrew Sands SC Northwestern 2024 C 87.6 mph
6 Reid Baxley SC Johnsonville 2024 2B 87.5 mph
7 Gunner Jordan SC Cheraw 2024 1B 86.7 mph
8 Cole Canty SC Rock Hill 2024 OF 86.1 mph
9 Tyler Rosario SC Legion Collegiate 2024 3B 84.7 mph
10 BJ Jeter SC Union County 2024 OF 83.8 mph


DISTANCE OFF THE BAT


TrackMan is able to measure and track the ball while in the air.  For every fair ball put in play it will display the distance the hit traveled.


Peak Distance - Best of the Hitter’s Session


Rank Name State School Class Pos Distance (max)
1 Lane McGaha SC Belton Honea Path 2024 1B 386 ft
2 Chas Welch SC Dorman 2023 OF 377 ft
3 BJ Jeter SC Union County 2024 OF 373 ft
4 Chancellor Jennings SC Gilbert 2023 OF 366 ft
5 Mitch Wilson SC Dorman 2024 C 359 ft
6 Cole Canty SC Rock Hill 2024 OF 354 ft
7 Gunner Jordan SC Cheraw 2024 1B 352 ft
8 Cooper DeVries SC Eastside 2027 OF 346 ft
9 Tyler Rosario SC Legion Collegiate 2024 3B 344 ft
10 Jack Coletti SC Chapin 2024 2B 342 ft


Average Distance - Average of each ball tracked in the Session


Rank Name State School Class Pos Distance (avg)
1 Lane McGaha SC Belton Honea Path 2024 1B 292 ft
2 Andrew Sands SC Northwestern 2024 C 290 ft
3 Mitch Wilson SC Dorman 2024 C 286 ft
4 Chas Welch SC Dorman 2023 OF 267 ft
5 Samuel Schwamb SC Catawba Ridge 2025 C 262 ft
6 BJ Jeter SC Union County 2024 OF 257 ft
7 Cole Canty SC Rock Hill 2024 OF 257 ft
8 Cooper DeVries SC Eastside 2027 OF 251 ft
9 Johnny Compton SC Indian Land 2026 SS 247 ft
10 Will Howard SC Emerald 2025 RHP 237 ft


LAUNCH ANGLE PERCENTAGE

Based on the ball flight, TrackMan is able to identify each hit as a ground ball, line drive, or fly ball.  While there are many factors as to why a hitter may approach each pitch in a certain way, the overall groupings of BP can give some insight to each hitter's approach.

Line Drive %


Rank Name State School Class Pos Line Drive %
1 Luke Westrol SC Riverside 2024 C 75 %
2 Ayden Clay SC Pendleton 2025 SS 66 %
3 Jeb Britt SC Cardinal Newman 2024 RHP 62 %
4 Xander Sutton NC Gaston Christian 2026 C 58 %
5 Jacob Johnson SC Riverside 2026 C 55 %
6 Jackson Holmes SC Westside 2025 RHP 54 %
7 Gunner Jordan SC Cheraw 2024 1B 53 %
^ Carver Youngblood SC Hillcrest 2026 OF 53 %
^ Jack Coletti SC Chapin 2024 2B 53 %
^ Max Whitfield SC Wren 2025 OF 53 %
^ William Meredith SC Emerald High 2025 LHP 53 %
8 Tyler Rosario SC Legion Collegiate 2024 3B 50 %
^ Joel Irizarry SC Fountain Inn 2025 C 50 %
^ Cole Canty SC Rock Hill 2024 OF 50 %
^ Jesse English SC Irmo 2024 RHP 50 %
^ Brody Sanders SC Buford 2023 C 50 %
^ Chancellor Jennings SC Gilbert 2023 OF 50 %
^ Kaleb Owens SC Easley 2024 RHP 50 %
9 Brandon Anderson SC Hartsville 2026 OF 45 %
^ Aaron Tolbert SC Easley 2025 C 45 %
10 Maximus Wearing NC Palisades 2026 1B 44 %


Fly Ball %


Rank Name State School Class Pos Fly Ball %
1 Andrew Sands SC Northwestern 2024 C 75.0 %
2 Yariel Vega-Soto SC Catawba Ridge 2025 C 68.2 %
3 John Nypaver SC Legion Collegiate Academy 2027 LHP 66.7 %
^ BJ Jeter SC Union County 2024 OF 66.7 %
4 Samuel Schwamb SC Catawba Ridge 2025 C 64.3 %
5 Lane McGaha SC Belton Honea Path 2024 1B 61.5 %
^ John Walter Whisenhunt SC Christ Church Episcopal 2025 C 61.5 %
^ Mitch Wilson SC Dorman 2024 C 61.5 %
6 Cooper DeVries SC Eastside 2027 OF 60.0 %
7 Cooper Sears SC Easley High 2026 C 58.3 %
8 Chas Welch SC Dorman 2023 OF 57.1 %
^ Johnny Compton SC Indian Land 2026 SS 57.1 %
9 AnTony Shannon SC Lancaster Bruins 2024 SS 54.5 %
10 Matthew Moore SC Dreher 2023 RHP 53.3 %


Ground Ball %


Rank Name State School Class Pos Ground Ball %
1 Henry Dryden SC St. Joseph Catholic 2025 2B 69 %
2 Reid Baxley SC Johnsonville 2024 2B 58 %
^ Jaden Atkinson SC Hartsville 2026 2B 58 %
3 Kason Herlong SC Lake View 2025 SS 50 %
4 Kamari Moore SC Rock Hill 2024 OF 46 %
5 Anthony Marano SC Clover High 2026 OF 45 %
^ Dalton Ligon SC Northwestern 2026 OF 45 %
^ Trenton Trotter SC Great Falls 2026 SS 45 %
6 Jacob Muir SC Dreher 2024 OF 42 %
^ Greyson Davis SC Daniel 2025 2B 42 %
7 Beau Hite SC Emerald 2028 SS 41 %
8 Justin C. Pendergrass SC Sumter High School 2025 RHP 40 %
^ Reece Oakley SC TL Hanna 2026 C 40 %
^ Julian Baldwin SC DW Daniel 2025 OF 40 %
9 Aaron Tolbert SC Easley 2025 C 36 %
10 Cooper Gladson SC Riverside 2025 3B 35 %