Trackman Traits- Hitting: 2022 OF/1B Gavyn Boyle (Royalton-Hartland)
December 31, 2020
Welcome to the hitting side of Trackman Traits. In this series we will spotlight one player each week who stood out during this 2020 season and take a deeper dive into their numbers and take a look at some that really stand out. Since the implementation of the Trackman technology to our showcases this summer we have been fortunate enough to have seen a great deal of talent come through the system. Today, we will be taking a look at the number four outfielder in New York's 2022 class, Gavyn Boyle.
Before we get started, we'll go over and define some of the terminology being used in the piece.
Exit Velocity- this one's pretty simple but this metric measures the speed of the ball off the bat, measured in miles per hour (MPH).
Distance- another simple one, this metric measures how far the ball traveled or would travel if it was not obstructed, measured in feet.
Launch Angle- measures the vertical angle of the ball as it leaves the bat. Positive numbers represent balls traveling upward off of the bat and negative numbers mean the ball is traveling downward off of the bat.
Fly Ball %- Percentage of fly balls hit during a given set of batted ball events. Trackman defines a fly ball as any batted ball with a launch angle between 25 degrees and 49.9 degrees.
Line Drive%- Percentage of line drives hit during a given set of batted ball events. Trackman defines a line drive as any batted ball with a launch angle between 10 degrees and 24.9 degrees.
Ground Ball %- Percentage of ground balls hit during a given set of batted ball events. Trackman defines a ground ball as any batted ball with a launch angle below 9.9 degrees.
Hard Hit%- Percentage of batted balls with an exit velocity of 90 MPH or higher.
Bat Speed- The speed of the sweet spot of the bat at impact, measured in MPH. The sweet spot is measured 6 inches from the tip of the bat. - Blast Motion
Hand Speed- The speed of the handle of the bat just before impact, measured in MPH. The handle us measured 6 inches from the knob of the bat. - Blast Motion
Rotational Acceleration- A measure of how quickly the hitter gets from launch position to being on plane. This is measured in G-Force (g). - Blast Motion

TRACKMAN DATA ANALYSIS
Boyle, the VCU commit, had a couple of nice showings during the 2020 season. We got a chance to get our eyes and technology on Boyle at the 2020 NYS Games and he earned a trip to DuBois for the Futures Games. Let's take a look at what he did during the NYS Games.
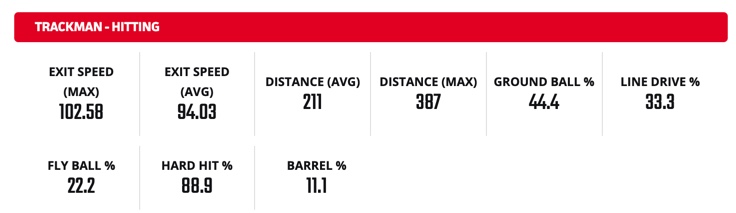
The numbers that jump off the page to me are the exit speeds and the hard hit %. His max exit speed of about 103 MPH is legit, there is plenty of pop in that bat, and he is able to hit the ball hard consistently as evidence by the nearly 90% hard hit % and 94 MPH average exit speed. These numbers all point to someone with power potential. His max distance was 387 ft, showing when he gets the ball in the air he has the ability to hit the ball a long ways.
Players who hit the ball as hard as Gavyn Boyle do are generally going to get rewarded for it no matter if they're hitting fly balls, line drives, or ground balls. As we covered last week, there are plenty of benefits of hitting the ball in the air. If he could raise his line drive and fly ball percentages, his average distance would be a lot closer to his max distance. While the "elevate and celebrate" approach of hitting the ball in the air may work for some, it's not the only approach that equals success. Boyle hit more ground balls than he did line drives or fly balls, so let's see how ground ball hitters find their success.
To do this, we'll take another look at the Statcast Exit Velocity & Launch Angle Field Breakdown to see what kind of success can be had when hitting the ball on the ground. For those unfamiliar, this tool allows you to input an exit velocity and launch angle and it will generate a plot of all the times that exact combination happened in an MLB game and show the results of all of those specific batted ball events. I would definitely recommend this tool to get a better understanding of the relationship between exit velocity and launch angle. For comparison's sake, we'll look at ground balls hit with 0 degrees of launch angle with exit velocities at 94 MPH and 103 MPH, Boyle's average and max exit velocities.
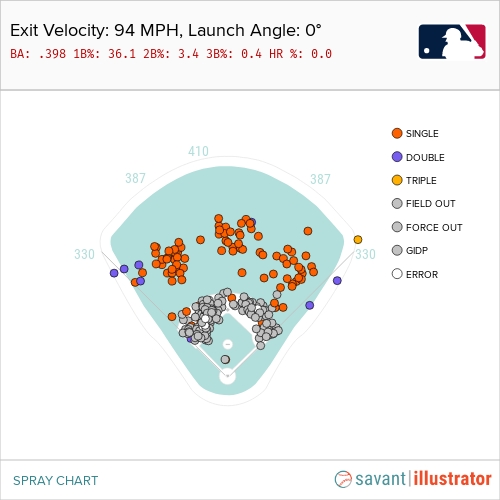
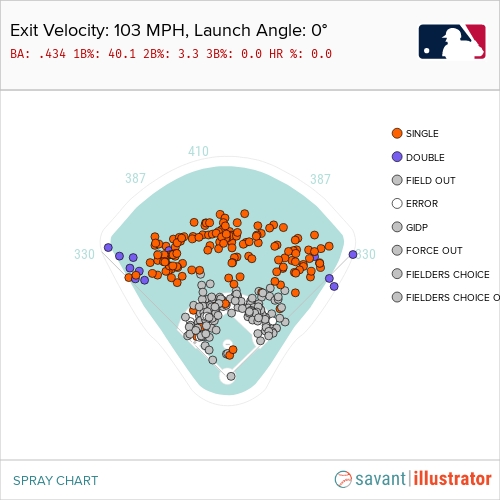
As we can see, there are plenty of base hits to be had when hitting the ball on the ground. There are a few interesting things to point out here, however. As expected, the batting average increases with increased exit velocity, infielders simply have less time to react to a ground ball ball being hit 103 MPH as opposed to one being hit 94 MPH. A .398 batting average and a .434 batting average is the result when there are big leaguers playing the infield, so one could assume those numbers would be higher when there are not big leaguers playing the infield. Plenty of success to be had on the ground. What's interesting to me is the jump in batting average with increased exit velocity is not quite as significant as it would be when a player is hitting line drives or fly balls. With those balls that are hit in the air, an increase in almost 10 MPH in exit velocity can turn routine fly balls to ones that get over outfielders heads and wall-ball doubles into no-doubt homers. While there is still an increase in batting average with increased exit velocity, the rewards are not as great when the ball is hit on the ground. Further evidence of this can be seen when looking at the extra base hit percentages. Balls hit with a 94 MPH exit velocity and 0 degree launch angle resulted in extra bases 3.8% of the time. When that exit velocity jumps to 103 MPH, it resulted in just 3.3% extra-base hits. While this is not a significant drop off, it shows there is a bit of a diminishing return when hitting the ball harder on the ground.
BLAST CONNECTION
Trackman does a great job showing the outcomes of players swings and their batted ball events. Its data is results based, the best numbers come when you get off your best swing and make your best contact. Blast Motion technology, also implemented at the same time this summer as the Trackman, tracks the swing data of a player and can shine a light into what a player does well in their swing. When paired with Trackman data, it can paint a more complete picture of a hitter and help explain why a player is able to hit the ball harder, farther, and more consistently than others.
Boyle lit up the Trackman with some big numbers, but he was a standout in plenty of Blast metrics as well. Some Blast metrics I like to look at are bat speed, hand speed, and rotational acceleration. Bat speed and hand speed will sometimes get bunched together, but I prefer to look at hand speed and rotational acceleration together. These two metrics are major influences in what your bat speed is going to be, someone who has quick hands is likely to have a faster bat speed just like someone who can sequence properly and use their lower half in their swing.
Boyle had a max bat speed of 76.8 MPH and a 75.05 MPH average bat speed, both advanced numbers for high school and college level players. He did this through electric hand speed, his 25.38 MPH average hand speed was tops at the 2020 NYS Games and his 27 MPH max hand speed finished second. Clear indicator right there of where some of that bat speed is coming from. Another indicator would be his rotational acceleration, where he had a max of 26 G's and his average of 23.73 G's was good enough to place him in the top 20 for the event.
CONCLUSION
Gavyn Boyle was a really impressive dude to watch this summer. His sweet stroke from the left side produced some big time numbers and he will be another guy to keep an eye on for the upcoming 2021 season.
Recent Trackman Traits
UPCOMING EVENTS