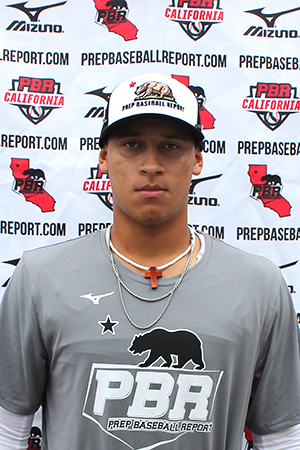
CLASS OF 2023
SS
2B
JP
Acosta
Fresno City College
Buchanan (HS) • CA
5' 11" • 190LBS
S/R • 20yr 11mo
Travel Team: Meta Prime 2023
Buchanan (HS) • CA
5' 11" • 190LBS
S/R • 20yr 11mo
Travel Team: Meta Prime 2023
Rankings
2023 National
Rankings available to Premium Subscriber
2023 State
Rankings available to Premium Subscriber
Commitment
Best Of Stats
22.6
Hand Speed (max)
2/06/21
72.4
Bat Speed (max)
2/06/21
21.1
Rot. Acc (max)
6/05/22
23
Hard Hit %
2/06/21
93.5
Exit Velocity (max)
2/06/21
85.1
Exit Velocity (avg)
6/05/22
345
Distance (max)
6/05/22
54
Sweet Spot %
2/06/21
7.14
60
6/05/22
-
30-yd
-
10-yd
-
Run speed (max)
84
INF Velo
2/06/21
-
OF Velo
-
C Velo
-
Pop Time
Positional Tools
2022
2021
60 Yard Dash
The athlete's fastest 60-yard dash time in the given event year. Measured in seconds (s)
7.14
Infield Velocity
The athlete's maximum throwing velocity from an infield position in the given event year. Measured in miles per hour (MPH).
81.0
Power / Speed Score
A simple calculation that divides the athlete’s Exit Velocity Max by the athlete’s 60 Yard Dash time for the given event year. For example, 98 MPH / 7.00s = 14.00.
12.8
60 Yard Dash
The athlete's fastest 60-yard dash time in the given event year. Measured in seconds (s)
7.32
Infield Velocity
The athlete's maximum throwing velocity from an infield position in the given event year. Measured in miles per hour (MPH).
84.0
Power / Speed Score
A simple calculation that divides the athlete’s Exit Velocity Max by the athlete’s 60 Yard Dash time for the given event year. For example, 98 MPH / 7.00s = 14.00.
12.8
Hitting

2022
2021
Exit Velocity Max
The highest exit velocity of any batted ball in the given event year. Measured in miles per hour (MPH).
91.4
Exit Velocity Avg
Average exit velocity of all batted balls in the given event year. Measured in miles per hour (MPH).
85.1
Distance Max
The highest flight distance of any batted ball in the given event year. Measured in feet (ft).
345
Distance Avg
Average flight distance of all batted balls in the given event year. Measured in feet (ft).
197
Launch Angle Avg
Average launch angle of all batted balls in the given event year. Measured in degrees.
17.6
Hard Hit %
Percentage of batted balls with exit velocities over 95 MPH in the given event year.
Sweet Spot %
Percentage of batted balls in the given event year with a launch angle between 8° and 32°.
Line Drive %
Percentage of batted balls with launch angles between 10 and 25 degrees in the given event year.
Fly Ball %
Percentage of batted balls with launch angles between 25 and 50 degrees in the given event year.
Ground Ball %
Percentage of batted balls with launch angles below 10 degrees in the given event year.
Exit Velocity Max
The highest exit velocity of any batted ball in the given event year. Measured in miles per hour (MPH).
93.5
Exit Velocity Avg
Average exit velocity of all batted balls in the given event year. Measured in miles per hour (MPH).
80.3
Distance Max
The highest flight distance of any batted ball in the given event year. Measured in feet (ft).
315
Distance Avg
Average flight distance of all batted balls in the given event year. Measured in feet (ft).
207
Launch Angle Avg
Average launch angle of all batted balls in the given event year. Measured in degrees.
20.8
Hard Hit %
Percentage of batted balls with exit velocities over 95 MPH in the given event year.
Sweet Spot %
Percentage of batted balls in the given event year with a launch angle between 8° and 32°.
Line Drive %
Percentage of batted balls with launch angles between 10 and 25 degrees in the given event year.
Fly Ball %
Percentage of batted balls with launch angles between 25 and 50 degrees in the given event year.
Ground Ball %
Percentage of batted balls with launch angles below 10 degrees in the given event year.
2022 NorCal ProCase (INVITE ONLY)
Jun 5, 2022
Trackman - Hitting
91.4
Exit Velocity (max)
85.1
Exit Velocity (avg)
197
Distance (avg)
345
Distance (max)
Hard Hit %
Sweet Spot %
Line Drive %
Fly Ball %
Ground Ball %
Preseason All-State (2023/2024)
Feb 6, 2021
Trackman - Hitting
93.5
Exit Velocity (max)
80.3
Exit Velocity (avg)
207
Distance (avg)
315
Distance (max)
Hard Hit %
Sweet Spot %
Line Drive %
Fly Ball %
Ground Ball %
Hitting

2022
2021
Hand Speed Max
The highest Peak Hand Speed of any swing in the given event year.
19.5
Hand Speed Avg
The average Peak Hand Speed for all swings in the given event year.
17.9
Bat Speed Max
The highest Bat Speed of any swing in the given event year.
67.5
Bat Speed Avg
The average Bat Speed for all swings in the given event year.
62.9
Rotational Acceleration Max
The highest Rotational Acceleration of any swing in the given event year.
Rotational Acceleration Avg
The average Rotational Acceleration for all swings in the given event year.
On-Plane Efficiency Max
The highest On-Plane Efficiency of any swing in the given event year.
On-Plane Efficiency Avg
The average On-Plane Efficiency for all swings in the given event year.
Hand Speed Max
The highest Peak Hand Speed of any swing in the given event year.
22.6
Hand Speed Avg
The average Peak Hand Speed for all swings in the given event year.
20.9
Bat Speed Max
The highest Bat Speed of any swing in the given event year.
72.4
Bat Speed Avg
The average Bat Speed for all swings in the given event year.
68.3
Rotational Acceleration Max
The highest Rotational Acceleration of any swing in the given event year.
Rotational Acceleration Avg
The average Rotational Acceleration for all swings in the given event year.
On-Plane Efficiency Max
The highest On-Plane Efficiency of any swing in the given event year.
On-Plane Efficiency Avg
The average On-Plane Efficiency for all swings in the given event year.
2022 NorCal ProCase (INVITE ONLY)
Jun 5, 2022
Blast - Hitting
19.5
Hand Speed (max)
17.9
Hand Speed (avg)
67.5
Bat Speed (max)
62.9
Bat Speed (avg)
Rot. Acc (max)
Rot. Acc (avg)
On Plane Eff (avg)
MaxOnPlaneEfficiency
Preseason All-State (2023/2024)
Feb 6, 2021
Blast - Hitting
22.6
Hand Speed (max)
20.9
Hand Speed (avg)
72.4
Bat Speed (max)
68.3
Bat Speed (avg)
Rot. Acc (max)
Rot. Acc (avg)
On Plane Eff (avg)
MaxOnPlaneEfficiency
Pitching

Pitch Scores
Pitching Velos
Game Performance

Visual Edge

Pitch Ai

Notes
News
- Prep Baseball JUCO Wire: Top 150 Prospects - Dec 14, 2023
- NORCAL PLAYER OF THE WEEK - Apr 11, 2023
- Area Code Games: Standout Position Players - Aug 19, 2022
- Northern California ProCase: TrackMan Hitting Leaderboard - Jun 20, 2022
- Northern California ProCase: Blast Motion Leaderboard - Jun 16, 2022
- Northern California ProCase: Stat Leaders - Jun 9, 2022
- CLASS of 2023 CA PLAYER RANKINGS - Sep 2, 2021
- INSIDE THE 2023 RANKINGS: INFIELDERS - May 10, 2021
- First Look: Underclass Preseason All-State - Mar 1, 2021
- Preseason All-State: Scouting Reports - Underclass Infielders - Feb 18, 2021
- Underclass Preseason All-State Quick Hits - Feb 8, 2021
- Class of 2023 State Rankings - Oct 1, 2020
- Norcal 9 - Way too early look at 2021 - Apr 2, 2020
- Class of 2023 State Rankings - Nov 12, 2019
Comments
Draft Reports
Contact
Premium Content Area
To unlock contact information, you need to purchase a ScoutPLUS subscription.
Purchase Subscription OR
Login


 Sign in to view rankings
at Cardinal Newman: Long Beach State commit; evolving at the plate, showing bat talent that could catch up to his significant glove and arm ability, hard contact twice in middle of field (line drives) and F9 later in game showing middle/oppo approach, plays easy on the move, plays with some edge and flair that comes naturally to him, one of top SS in the state in the class and chance to raise his national profile as 2023 draft approaches.
Body: 5-11, 165-pounds. Long and lanky frame with plenty of space for more projection. Lots of athleticism in the frame
Hit: SH. RH: Loose and relaxed at the plate with higher front leg kick keeping connection with ground. Controlled approach to the baseball allowing the lower half to get swing started.
LH: Similar looseness, kick in load; a little bit more rock into the backside/frontside on LH. More rotational this side. Quick and fluid rotation allowing him to unwind through the zone and let quick hands do work out front. RH more natural right now with LH being a bit steeper, but the skills are present to be a strong switch-hitter at next level. 17.8 gs Max Rotational Acceleration, 22.6 Max Handspeed, 72.4 Max Batspeed, 55% On Plane Efficiency.
Power: 93.50 mph exit velocity.
Arm: RH. INF - 84.00 mph. Above average arm strength for level. Short and whippy arm action. Quick in getting to release. 3/5 accurate throws in defensive workout.
Defense: Showed light and quick feet. Sets up his feet in good positions to set up momentum towards 1st. Very strong rhythm and timing with his fielding. Soft hands and clean exchanges as well.
Run: 7.32 runner in the 60.