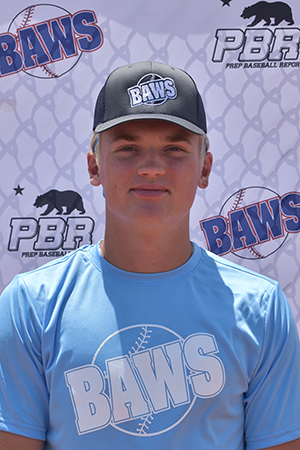
CLASS OF 2024
OF
LHP
TP
Wentworth
Clemson
Central Catholic (HS) • CA
6' 5" • 225LBS
L/L • 19yr 3mo
Travel Team: Alpha Prime 2024
Central Catholic (HS) • CA
6' 5" • 225LBS
L/L • 19yr 3mo
Travel Team: Alpha Prime 2024
Rankings
2024 National
Rankings available to Premium Subscriber
2024 State
Rankings available to Premium Subscriber
Commitment
Best Of Stats
22.5
Hand Speed (max)
6/09/23
79.5
Bat Speed (max)
6/09/23
24.8
Rot. Acc (max)
6/04/23
100
Hard Hit %
6/09/23
99.6
Exit Velocity (max)
6/09/23
95.5
Exit Velocity (avg)
6/09/23
388
Distance (max)
6/09/23
65
Sweet Spot %
6/04/23
6.6
60
6/04/23
3.7
30-yd
6/04/23
1.59
10-yd
6/04/23
21.1
Run speed (max)
6/04/23
-
INF Velo
91
OF Velo
6/09/23
-
C Velo
-
Pop Time
Fastball
89
Velocity (max)
6/27/23
87 - 88
Velo Range
6/27/23
2056
Spin Rate (avg)
6/09/23
Changeup
83 - 84
Velo Range
6/27/23
-
Spin Rate (avg)
Curveball
74 - 76
Velo Range
5/19/22
-
Spin Rate (avg)
Slider
76 - 80
Velo Range
6/27/23
1775
Spin Rate (avg)
6/09/23
Positional Tools
2023
2021
60 Yard Dash
The athlete's fastest 60-yard dash time in the given event year. Measured in seconds (s)
6.65
Outfield Velocity
The athlete's maximum throwing velocity from an outfield position in the given event year. Measured in miles per hour (MPH).
91.0
Power / Speed Score
A simple calculation that divides the athlete’s Exit Velocity Max by the athlete’s 60 Yard Dash time for the given event year. For example, 98 MPH / 7.00s = 14.00.
15.0
60 Yard Dash
The athlete's fastest 60-yard dash time in the given event year. Measured in seconds (s)
7.10
Hitting

2023
Exit Velocity Max
The highest exit velocity of any batted ball in the given event year. Measured in miles per hour (MPH).
99.6
Exit Velocity Avg
Average exit velocity of all batted balls in the given event year. Measured in miles per hour (MPH).
94.9
Distance Max
The highest flight distance of any batted ball in the given event year. Measured in feet (ft).
388
Distance Avg
Average flight distance of all batted balls in the given event year. Measured in feet (ft).
272
Launch Angle Avg
Average launch angle of all batted balls in the given event year. Measured in degrees.
20.1
Hard Hit %
Percentage of batted balls with exit velocities over 95 MPH in the given event year.
Sweet Spot %
Percentage of batted balls in the given event year with a launch angle between 8° and 32°.
Line Drive %
Percentage of batted balls with launch angles between 10 and 25 degrees in the given event year.
Fly Ball %
Percentage of batted balls with launch angles between 25 and 50 degrees in the given event year.
Ground Ball %
Percentage of batted balls with launch angles below 10 degrees in the given event year.
BAWS 2023
Jun 9, 2023
Trackman - Hitting
99.6
Exit Velocity (max)
95.5
Exit Velocity (avg)
307
Distance (avg)
388
Distance (max)
Hard Hit %
Sweet Spot %
Line Drive %
Fly Ball %
Ground Ball %
NorCal ProCase
Jun 4, 2023
Trackman - Hitting
97.7
Exit Velocity (max)
94.6
Exit Velocity (avg)
256
Distance (avg)
372
Distance (max)
Hard Hit %
Sweet Spot %
Line Drive %
Fly Ball %
Ground Ball %
Hitting

2023
Hand Speed Max
The highest Peak Hand Speed of any swing in the given event year.
22.5
Hand Speed Avg
The average Peak Hand Speed for all swings in the given event year.
21.6
Bat Speed Max
The highest Bat Speed of any swing in the given event year.
79.5
Bat Speed Avg
The average Bat Speed for all swings in the given event year.
72.1
Rotational Acceleration Max
The highest Rotational Acceleration of any swing in the given event year.
Rotational Acceleration Avg
The average Rotational Acceleration for all swings in the given event year.
On-Plane Efficiency Max
The highest On-Plane Efficiency of any swing in the given event year.
On-Plane Efficiency Avg
The average On-Plane Efficiency for all swings in the given event year.
BAWS 2023
Jun 9, 2023
Blast - Hitting
22.5
Hand Speed (max)
21.8
Hand Speed (avg)
79.5
Bat Speed (max)
75.5
Bat Speed (avg)
Rot. Acc (max)
Rot. Acc (avg)
On Plane Eff (avg)
MaxOnPlaneEfficiency
NorCal ProCase
Jun 4, 2023
Blast - Hitting
22.3
Hand Speed (max)
21.5
Hand Speed (avg)
72.3
Bat Speed (max)
69.2
Bat Speed (avg)
Rot. Acc (max)
Rot. Acc (avg)
On Plane Eff (avg)
MaxOnPlaneEfficiency
Pitching

2023
Fastball
Velocity Max
The maximum observed fastball velocity in the given event year. Measured in miles per hour (MPH).
87.7
Fastball
Velocity Avg
The average velocity for all pitches of this type in the given event year. Measured in miles per hour (MPH).
86.1
Fastball
Spin Rate Avg
The average rate of spin for all pitches of this type in the given event year. Measured in rotations per minute (RPM).
2056
Fastball
Spin Score Avg
The average Bauer Units value of all fastballs in the given event year. Bauer Units are calculated for each pitch by dividing Spin Rate by Velocity.
23.9
Fastball
Total Movement Avg
The average total non-gravity movement for all pitches of this type in the given event year. Measured in inches (in).
Slider
Velocity Avg
The average velocity for all pitches of this type in the given event year. Measured in miles per hour (MPH).
76.7
Slider
Spin Rate Avg
The average rate of spin for all pitches of this type in the given event year. Measured in rotations per minute (RPM).
1775
Slider
Total Movement Avg
The average total non-gravity movement for all pitches of this type in the given event year. Measured in inches (in).
BAWS 2023
Jun 9, 2023
Trackman - Fastball
87.7
Velocity (max)
85.4 - 86.9
Velo Range
84.1
Eff Velocity (avg)
2,171
Spin Rate (max)
2,056
Spin Rate (avg)
IVB (max)
IVB (avg)
HM (max)
HM (avg)
Extension (avg)
Release Ht (avg)
Spin Score (max)
Zone %
Spin Efficiency % (avg)
Trackman - Slider
78.0
Velocity (max)
75.6 - 77.9
Velo Range
73.8
Eff Velocity (avg)
2,003
Spin Rate (max)
1,775
Spin Rate (avg)
IVB (max)
IVB (avg)
HM (max)
HM (avg)
Extension (avg)
Release Ht (avg)
Spin Score (max)
Zone %
Spin Efficiency % (avg)
Pitch Scores
2023
Fastball
Hop+
A fastball with hop has a flat approach angle and visually jumps through the zone. When thrown up in the zone, it is more likely to generate a higher swing and miss average. Hop+ of 100 is MLB average.
Fastball
Sink+
A fastball with sink has low backspin and drops through the strike zone. When thrown down in the zone, it is more likely to generate a higher ground ball percentage and lower launch angle. Sink+ of 100 is MLB average.
Fastball
Rise+
A fastball with rise has a high percentage of backspin. When thrown up in the zone, it is more likely to generate a higher fly ball percentage. Rise+ of 100 is MLB average
Pitching Velos
2023
2022
Fastball
Velocity Max
The maximum observed fastball velocity in the given event year. Measured in miles per hour (MPH).
89.0
Fastball
Velocity Avg
The average velocity for all pitches of this type in the given event year. Measured in miles per hour (MPH)
87.5
Changeup
Velocity Avg
The average velocity for all pitches of this type in the given event year. Measured in miles per hour (MPH)
83.5
Slider
Velocity Avg
The average velocity for all pitches of this type in the given event year. Measured in miles per hour (MPH)
78.0
Fastball
Velocity Max
The maximum observed fastball velocity in the given event year. Measured in miles per hour (MPH).
87.0
Fastball
Velocity Avg
The average velocity for all pitches of this type in the given event year. Measured in miles per hour (MPH)
85.0
Curveball
Velocity Avg
The average velocity for all pitches of this type in the given event year. Measured in miles per hour (MPH)
75.0
Changeup
Velocity Avg
The average velocity for all pitches of this type in the given event year. Measured in miles per hour (MPH)
75.5
Slider
Velocity Avg
The average velocity for all pitches of this type in the given event year. Measured in miles per hour (MPH)
77.5
Game Performance

2023
10 Yard Dash
The athlete's fastest 0-10-yard split time in the given event year. Measured in seconds.
1.59
30 Yard Dash
The athlete's fastest 0-30-yard split time in the given event year. Measured in seconds.
3.70
60 Yard Dash
The athlete's fastest 0-60-yard time in the given event year. Measured in seconds.
6.60
Top Speed (MPH)
The athlete's fastest split time converted to miles per hour.
Visual Edge

Pitch Ai

Notes
News
- California All-State Team - Jun 26, 2024
- NorCal Uncommitteds at Area Code Games - Jul 20, 2023
- Almost Famous: 25 Summer Helium Candidates - Jun 1, 2023
- 2024 Rankings Update - May 11, 2023
- CA RANKINGS UPDATE: CLASS OF 2024 - Mar 23, 2022
- Class of 2024 Rankings Update - Oct 7, 2021
- Class of 2024 Rankings - Jun 4, 2021
Comments
Draft Reports
Contact
Premium Content Area
To unlock contact information, you need to purchase a ScoutPLUS subscription.
Purchase Subscription OR
Login


 Sign in to view rankings
ACG Tryout - Extremely athletic for his large 6-foot-5 frame. Three sport athlete. Balanced, physical uppercut through the zone. Easy pull side juice during batting practice (to HRs to RF). Glides around in the outfield with  his 6.6 second 60 and 90 mph outfield arm. Also thrives on the mound (upper 80s, T89) from a 3/4 release with a tight slider.
Event: NorCal ProCase
Positional Profile: OF/LHP
Physical: 6-5, 225 pounds; extremely physical and athletic; 6.60 60-yard dash
Offensively: LH. EV max – 97.7 mph, hand speed max – 22.3 mph, bat speed max – 72.3 mph; Tall and imposing presence in the box. Feet were slightly offset with bat coiled around his head. Short stride with an upward swing; Looks to drive the ball and do damage.
at Vanden HS - SJS D3 Semi-Final; Starter on mound, lead-off hitter in line-up, long streamlined body with lean strength throughout, competitve and gutty throughout at plate and on mound, faced senior-heavy line-up with multiple D1 commits, 6 IP, 1 R, 5 H, 2 BB, 10 K, 98 P (59 strikes); high-3/4 release, compact on backside with ability to hide ball, quick arm w/some recoil through finish, FB 84-87, held up to 86 in 6th inning, FB with late lateral run w/occasional explosive live, minimal sink, CB is steep with sharp disappearing bite below bats and in particular devastating vs RHH, CB (74-76) is legitimate K pitch, flashed harder breaking ball that was slider-ish 76-78 mph with less depth and not quite as sharp as the downer CB, mixed in a few CHG 75-76 mph, gets more downward life/action off the FB look, potential to emerge as one of California's top 2024 LHPs; offensively has physicality, swing/barrel works through the zone, balanced, took balls, was on time to strikes vs 88-91 RHP, multi-talented 2-way player, from this look it's the ability on mound that stood out brightest though has has plenty of succss at the plate so stands to reason he will be recruited as a 2-way and let it get sorted out at the college level.