CLASS OF 2023
RHP
SS
Zachary
Konstantinovsky
Rutgers
North Brunswick (HS) • NJ
6' 1" • 190LBS
R/R • 19yr 6mo
Travel Team: Baseball Warehouse
North Brunswick (HS) • NJ
6' 1" • 190LBS
R/R • 19yr 6mo
Travel Team: Baseball Warehouse
Rankings
2023 National
Rankings available to Premium Subscriber
2023 State
Rankings available to Premium Subscriber
Commitment
Best Of Stats
Fastball
91
Velocity (max)
6/16/22
87 - 90
Velo Range
6/16/22
2065
Spin Rate (avg)
7/05/20
Changeup
72 - 76
Velo Range
7/05/20
1709
Spin Rate (avg)
8/02/20
Curveball
76 - 77
Velo Range
6/16/22
1944
Spin Rate (avg)
8/02/20
91
Exit Velocity (max)
6/15/21
81.3
Exit Velocity (avg)
6/15/21
332
Distance (max)
6/15/21
82
Sweet Spot %
6/15/21
24.4
Hand Speed (max)
6/15/21
67.6
Bat Speed (max)
6/15/21
15.9
Rot. Acc (max)
6/15/21
18
Hard Hit %
6/15/21
7.49
60
6/15/21
-
30-yd
-
10-yd
-
Run speed (max)
85
INF Velo
6/15/21
-
OF Velo
-
C Velo
-
Pop Time
Positional Tools
2021
2020
2019
60 Yard Dash
The athlete's fastest 60-yard dash time in the given event year. Measured in seconds (s)
7.49
Infield Velocity
The athlete's maximum throwing velocity from an infield position in the given event year. Measured in miles per hour (MPH).
85.0
Power / Speed Score
A simple calculation that divides the athlete’s Exit Velocity Max by the athlete’s 60 Yard Dash time for the given event year. For example, 98 MPH / 7.00s = 14.00.
12.2
60 Yard Dash
The athlete's fastest 60-yard dash time in the given event year. Measured in seconds (s)
7.54
Infield Velocity
The athlete's maximum throwing velocity from an infield position in the given event year. Measured in miles per hour (MPH).
81.0
Power / Speed Score
A simple calculation that divides the athlete’s Exit Velocity Max by the athlete’s 60 Yard Dash time for the given event year. For example, 98 MPH / 7.00s = 14.00.
11.7
60 Yard Dash
The athlete's fastest 60-yard dash time in the given event year. Measured in seconds (s)
7.91
Infield Velocity
The athlete's maximum throwing velocity from an infield position in the given event year. Measured in miles per hour (MPH).
77.0
Power / Speed Score
A simple calculation that divides the athlete’s Exit Velocity Max by the athlete’s 60 Yard Dash time for the given event year. For example, 98 MPH / 7.00s = 14.00.
10.0
Hitting

2021
2020
Exit Velocity Max
The highest exit velocity of any batted ball in the given event year. Measured in miles per hour (MPH).
91.0
Exit Velocity Avg
Average exit velocity of all batted balls in the given event year. Measured in miles per hour (MPH).
81.3
Distance Max
The highest flight distance of any batted ball in the given event year. Measured in feet (ft).
332
Distance Avg
Average flight distance of all batted balls in the given event year. Measured in feet (ft).
257
Launch Angle Avg
Average launch angle of all batted balls in the given event year. Measured in degrees.
26.7
Hard Hit %
Percentage of batted balls with exit velocities over 95 MPH in the given event year.
Sweet Spot %
Percentage of batted balls in the given event year with a launch angle between 8° and 32°.
Line Drive %
Percentage of batted balls with launch angles between 10 and 25 degrees in the given event year.
Fly Ball %
Percentage of batted balls with launch angles between 25 and 50 degrees in the given event year.
Ground Ball %
Percentage of batted balls with launch angles below 10 degrees in the given event year.
Exit Velocity Max
The highest exit velocity of any batted ball in the given event year. Measured in miles per hour (MPH).
88.0
Exit Velocity Avg
Average exit velocity of all batted balls in the given event year. Measured in miles per hour (MPH).
80.8
Distance Max
The highest flight distance of any batted ball in the given event year. Measured in feet (ft).
331
Distance Avg
Average flight distance of all batted balls in the given event year. Measured in feet (ft).
251
Launch Angle Avg
Average launch angle of all batted balls in the given event year. Measured in degrees.
31.9
Hard Hit %
Percentage of batted balls with exit velocities over 95 MPH in the given event year.
Sweet Spot %
Percentage of batted balls in the given event year with a launch angle between 8° and 32°.
Line Drive %
Percentage of batted balls with launch angles between 10 and 25 degrees in the given event year.
Fly Ball %
Percentage of batted balls with launch angles between 25 and 50 degrees in the given event year.
Ground Ball %
Percentage of batted balls with launch angles below 10 degrees in the given event year.
Scout Day: Baseball Warehouse 6.15.21
Jun 15, 2021
Trackman - Hitting
91.0
Exit Velocity (max)
81.3
Exit Velocity (avg)
257
Distance (avg)
332
Distance (max)
Hard Hit %
Sweet Spot %
Line Drive %
Fly Ball %
Ground Ball %
2020 NJ Future Games Select (Session I)
Jul 5, 2020
Trackman - Hitting
88.0
Exit Velocity (max)
80.8
Exit Velocity (avg)
251
Distance (avg)
331
Distance (max)
Sweet Spot %
Line Drive %
Fly Ball %
Ground Ball %
Hitting

2021
Hand Speed Max
The highest Peak Hand Speed of any swing in the given event year.
24.4
Hand Speed Avg
The average Peak Hand Speed for all swings in the given event year.
20.3
Bat Speed Max
The highest Bat Speed of any swing in the given event year.
67.6
Bat Speed Avg
The average Bat Speed for all swings in the given event year.
63.6
Rotational Acceleration Max
The highest Rotational Acceleration of any swing in the given event year.
Rotational Acceleration Avg
The average Rotational Acceleration for all swings in the given event year.
On-Plane Efficiency Max
The highest On-Plane Efficiency of any swing in the given event year.
On-Plane Efficiency Avg
The average On-Plane Efficiency for all swings in the given event year.
Scout Day: Baseball Warehouse 6.15.21
Jun 15, 2021
Blast - Hitting
24.4
Hand Speed (max)
20.3
Hand Speed (avg)
67.6
Bat Speed (max)
63.6
Bat Speed (avg)
Rot. Acc (max)
Rot. Acc (avg)
On Plane Eff (avg)
MaxOnPlaneEfficiency
2020 NJ Future Games Select (Session I)
Jul 5, 2020
Blast - Hitting
20.4
Hand Speed (max)
18.6
Hand Speed (avg)
67.4
Bat Speed (max)
60.9
Bat Speed (avg)
Rot. Acc (max)
Rot. Acc (avg)
On Plane Eff (avg)
Pitching

2020
Fastball
Velocity Max
The maximum observed fastball velocity in the given event year. Measured in miles per hour (MPH).
85.3
Fastball
Velocity Avg
The average velocity for all pitches of this type in the given event year. Measured in miles per hour (MPH).
83.3
Fastball
Spin Rate Avg
The average rate of spin for all pitches of this type in the given event year. Measured in rotations per minute (RPM).
2056
Fastball
Spin Score Avg
The average Bauer Units value of all fastballs in the given event year. Bauer Units are calculated for each pitch by dividing Spin Rate by Velocity.
24.7
Fastball
Total Movement Avg
The average total non-gravity movement for all pitches of this type in the given event year. Measured in inches (in).
Curveball
Velocity Avg
The average velocity for all pitches of this type in the given event year. Measured in miles per hour (MPH).
71.6
Curveball
Spin Rate Avg
The average rate of spin for all pitches of this type in the given event year. Measured in rotations per minute (RPM).
1920
Curveball
Total Movement Avg
The average total non-gravity movement for all pitches of this type in the given event year. Measured in inches (in).
Changeup
Velocity Avg
The average velocity for all pitches of this type in the given event year. Measured in miles per hour (MPH).
72.7
Changeup
Spin Rate Avg
The average rate of spin for all pitches of this type in the given event year. Measured in rotations per minute (RPM).
1700
Changeup
Total Movement Avg
The average total non-gravity movement for all pitches of this type in the given event year. Measured in inches (in).
PBR Future Games (Team NJ Invite)
Aug 2, 2020
Trackman - Fastball
85.3
Velocity (max)
82.1 - 84.4
Velo Range
83.4
Eff Velocity (avg)
2,205
Spin Rate (max)
2,049
Spin Rate (avg)
IVB (max)
IVB (avg)
HM (max)
HM (avg)
Extension (avg)
Release Ht (avg)
Spin Score (max)
Zone %
Trackman - Curveball
72.8
Velocity (max)
70.8 - 72.8
Velo Range
71.9
Eff Velocity (avg)
2,069
Spin Rate (max)
1,944
Spin Rate (avg)
IVB (max)
IVB (avg)
HM (max)
HM (avg)
Extension (avg)
Release Ht (avg)
Spin Score (max)
Zone %
Trackman - ChangeUp
74.2
Velocity (max)
71.2 - 73.7
Velo Range
72.6
Eff Velocity (avg)
1,917
Spin Rate (max)
1,709
Spin Rate (avg)
IVB (max)
IVB (avg)
HM (max)
HM (avg)
Extension (avg)
Release Ht (avg)
Spin Score (max)
Zone %
2020 NJ Future Games Select (Session I)
Jul 5, 2020
Trackman - Fastball
84.9
Velocity (max)
82.6 - 84.4
Velo Range
83.1
Eff Velocity (avg)
2,265
Spin Rate (max)
2,065
Spin Rate (avg)
IVB (max)
IVB (avg)
HM (max)
HM (avg)
Extension (avg)
Release Ht (avg)
Spin Score (max)
Zone %
Trackman - Curveball
76.3
Velocity (max)
66.8 - 75.2
Velo Range
68.6
Eff Velocity (avg)
2,016
Spin Rate (max)
1,876
Spin Rate (avg)
IVB (max)
IVB (avg)
HM (max)
HM (avg)
Extension (avg)
Release Ht (avg)
Spin Score (max)
Zone %
Trackman - ChangeUp
76.7
Velocity (max)
71.2 - 74.9
Velo Range
73.2
Eff Velocity (avg)
1,849
Spin Rate (max)
1,689
Spin Rate (avg)
IVB (max)
IVB (avg)
HM (max)
HM (avg)
Extension (avg)
Release Ht (avg)
Spin Score (max)
Zone %
Pitch Scores
2020
Fastball
Hop+
A fastball with hop has a flat approach angle and visually jumps through the zone. When thrown up in the zone, it is more likely to generate a higher swing and miss average. Hop+ of 100 is MLB average.
Fastball
Sink+
A fastball with sink has low backspin and drops through the strike zone. When thrown down in the zone, it is more likely to generate a higher ground ball percentage and lower launch angle. Sink+ of 100 is MLB average.
Fastball
Rise+
A fastball with rise has a high percentage of backspin. When thrown up in the zone, it is more likely to generate a higher fly ball percentage. Rise+ of 100 is MLB average
Pitching Velos
2022
2020
2019
Fastball
Velocity Max
The maximum observed fastball velocity in the given event year. Measured in miles per hour (MPH).
91.0
Fastball
Velocity Avg
The average velocity for all pitches of this type in the given event year. Measured in miles per hour (MPH)
88.5
Curveball
Velocity Avg
The average velocity for all pitches of this type in the given event year. Measured in miles per hour (MPH)
76.5
Fastball
Velocity Max
The maximum observed fastball velocity in the given event year. Measured in miles per hour (MPH).
85.0
Fastball
Velocity Avg
The average velocity for all pitches of this type in the given event year. Measured in miles per hour (MPH)
84.2
Curveball
Velocity Avg
The average velocity for all pitches of this type in the given event year. Measured in miles per hour (MPH)
70.8
Changeup
Velocity Avg
The average velocity for all pitches of this type in the given event year. Measured in miles per hour (MPH)
74.2
Fastball
Velocity Max
The maximum observed fastball velocity in the given event year. Measured in miles per hour (MPH).
82.0
Fastball
Velocity Avg
The average velocity for all pitches of this type in the given event year. Measured in miles per hour (MPH)
81.0
Curveball
Velocity Avg
The average velocity for all pitches of this type in the given event year. Measured in miles per hour (MPH)
70.0
Changeup
Velocity Avg
The average velocity for all pitches of this type in the given event year. Measured in miles per hour (MPH)
70.5
Game Performance

Visual Edge

Pitch Ai

Notes
News
- NJ 2023 High School Scout Blog: Edition 5 - May 15, 2023
- NJ 2023 High School Scout Blog: Edition 2 - May 1, 2023
- Get to Know: Zachary Konstantinovsky - Jan 23, 2023
- Updated 2023 New Jersey Player Rankings - Sep 7, 2022
- 2022 Area Code Games: Standout Pitchers - Aug 18, 2022
- 2022 Area Code Games: Thursday's Five Best - Aug 12, 2022
- Updated NJ 2023 Rankings - May 12, 2022
- Top Performers: Wladyka / Baseball Warehouse Scout Day - Jul 20, 2021
- Updated and Expanded 2023 Rankings - May 12, 2020
- 2023 NJ State Rankings Unveiled - Nov 7, 2019
Comments
Draft Reports
Contact
Premium Content Area
To unlock contact information, you need to purchase a ScoutPLUS subscription.
Purchase Subscription OR
Login


 Sign in to view rankings
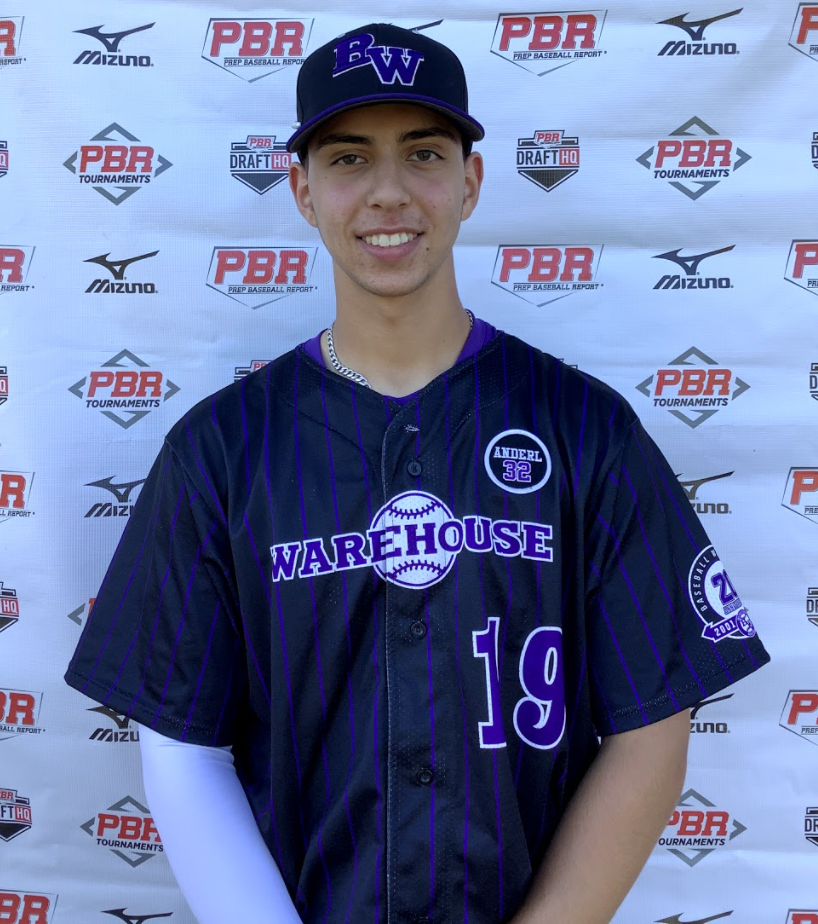
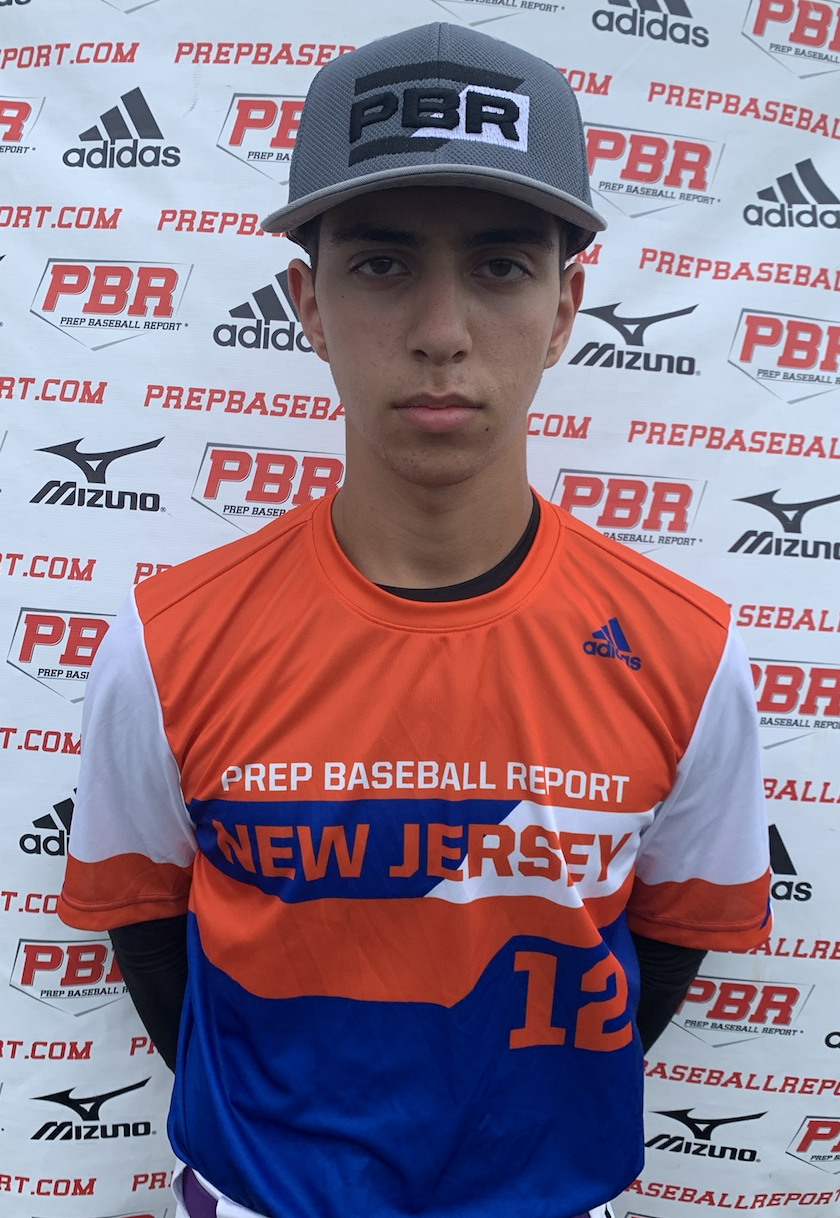
6-foot, 170-pound projectable frame. Recorded a 60 time of 7.54 at the event. Began in a tall open stance with a smooth load, then used a controlled stride before his swing. Bat speed is some, shows upward swing plane and high finish. He found some barrels during his round. the right-handed hitter had an exit velocity of 88 mph. Smooth while in the infield, recorded position velocities up to 81 mph; showed athletic feet, a clean exchange and twitchy hands. Consistent accuracy to the bag, used a high ¾ slot with a loose arm action. Projectable on the mound, showing quick arm speed he had a loose arm action with a high ¾ arm angle. Showed easy effort in his delivery. Displays even shoulders and athletic balance point. Lands square with an athletic finish. Produced a fastball that came in at 84-85 mph and topped out at 85 mph; has very consistent control and running action. Throws a 11/5 curveball (67-71) with late action and glove side control. Has fading action and arm side control on his changeup (72-76). One of the top performers on the mound at the event. Polished, easy effort with a lot to like.