Northern Nevada Prospect Open: Blast Leaderboard
August 27, 2021
The Northern Nevada Prospect Open was an opportunity for players from all over Northern Nevada to show off improvements made during the summer and increase their recruiting stock as we head into a crucial Fall season. This event featured a talented crop of players that should continue to generate interest over the next year and was one of the final events before the Fall PBR Player Ranking Updates are announced.
Players were put through a Pro-Style Workout, which consisted of a Laser Time 60 Yard Dash, a TrackMan and Blast Motion analyzed Batting Practice session, Catcher Evaluations that included Pop Times, Velocity, Receiving and Blocking, Outfield Evaluations and Infield Evaluations.
Full Northern Nevada Prospect Open Statistical Leaderboard - HERE
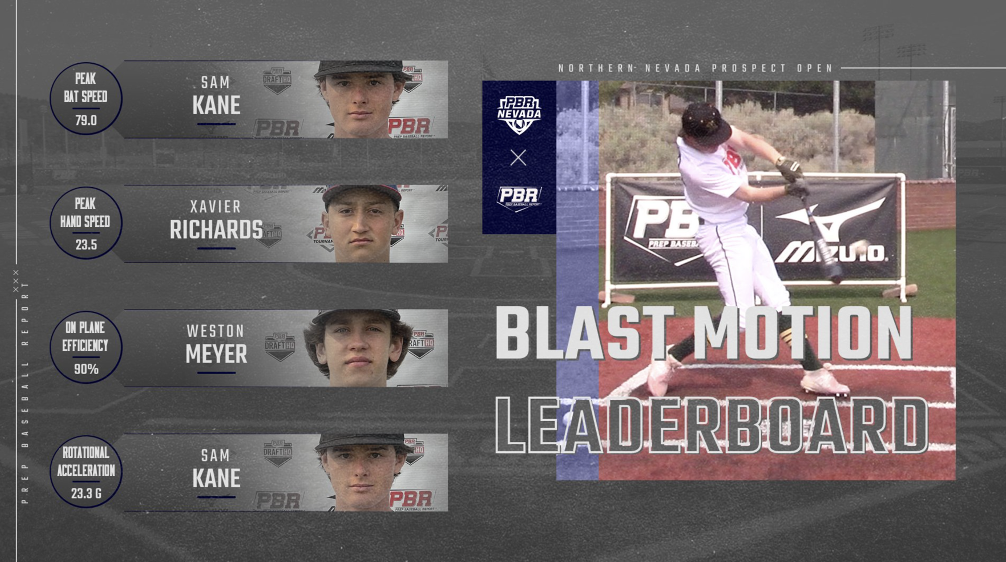
Today, we take a look at the Blast Motion Leaderboard that highlights the Top In-Swing Metrics collected from the Northern Nevada Prospect Open.
ABOUT BLAST MOTION:
One of the important tools Prep Baseball Report has implemented at its events is the use of Blast Motion sensors. During batting practice, the Blast Motion sensors measure Swing and Impact Metrics across several categories. Swing metrics measure pre-impact mechanics centered around plane, connection, and rotation while Impact metrics measure pre-impact performance outcomes based on ball contact.
HERE ARE THE TOP METRICS OF THE EVENT:
Top PEAK Bat Speed: 79.00 mph | Sam Kane - Bishop Manogue / 2023
Top PEAK Hand Speed: 23.50 mph | Xavier Richards - Reno / 2022
On-Plane Efficiency: 90% | Weston Meyer - Damonte Ranch / 2024
Rotational Acceleration: 23.27 g | Sam Kane - Bishop Manogue / 2023
Below will you find the swing & impact metrics from the event in four different categories (Top-15 listed):
______________________________________________________________
BAT SPEED:
Bat Speed is the observed speed of the sweet spot of the bat at impact. For more info: Blast Bat Speed
MLB Avg: 66-78 mph MiLB: 63-75 mph College: 66-75 mph
PEAK HAND SPEED:
Peak Hand Speed is the observed maximum speed as measured on the handle of the bat (measured six inches from the knob of the bat). Peak Hand Speed will occur prior to the moment of impact, very close to the commit time in the swing when the wrists unhinge. For more info: Peak Hand Speed
MLB Avg: 23-29 mph MiLB Avg: 22-28 mph College Avg: 21-24 mph
ON PLANE EFFICIENCY:
Measures the percentage of your swing where the bat is on the swing plane. Your vertical bat angle at contact establishes the plane for that swing. Plane is a great indicator for making more consistent contact on the barrel of the bat. For more info: On Plane Efficiency
Ideal Efficiency %: 70% or Higher Range: 65%-85%
ROTATIONAL ACCELERATION:
Measures how quickly your bat accelerates into the swing plane. Rotation is a good indicator of how you build bat speed by sequencing properly. The quicker your rotational acceleration, the more power you will have and the more time you have to adjust to pitch locations. For more info: Rotational Acceleration
MLB Avg: 16.8 g MiLB Avg: 12.6 g College Avg: 12.9 g
______________________________________________________________

UPCOMING EVENTS
| SHOWCASE | STATE | DATE | LOCATION |
| Nevada Fall Underclass Showcase | NV | 09/26 | College of Southern Nevada |
| PBR Nevada ProCase 2021 | NV | 10/24 | College of Southern Nevada |
| PBR x CSN Pro Day 2021 | NV | 10/24 | College of Southern Nevada |