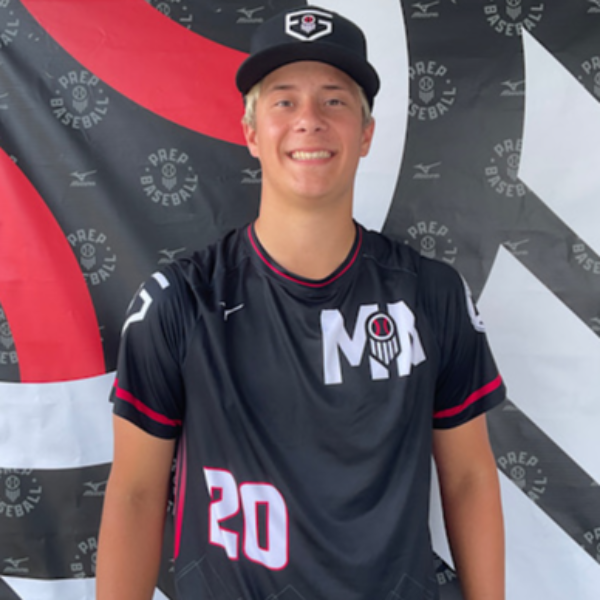
CLASS OF 2026
RHP
OF
Hudson
Ohm
ZUMBROTA-MAZEPPA SENIOR HIGH (HS) • MN
6' 2" • 192LBS
R/R • 16yr 9mo
Travel Team: MN Selects
6' 2" • 192LBS
R/R • 16yr 9mo
Travel Team: MN Selects
Rankings
2026 National
Rankings available to Premium Subscriber
2026 State
Rankings available to Premium Subscriber
Commitment
Best Of Stats
Fastball
91.5
Velocity (max)
10/06/24
90.6 - 91.3
Velo Range
10/06/24
2144
Spin Rate (avg)
6/17/24
Changeup
82 - 84
Velo Range
7/25/24
1874
Spin Rate (avg)
3/16/24
Curveball
77 - 80
Velo Range
7/25/24
2511
Spin Rate (avg)
10/02/22
Slider
78.4 - 80.4
Velo Range
10/06/24
2486
Spin Rate (avg)
10/06/24
61
INF Velo
3/18/23
-
OF Velo
-
C Velo
-
Pop Time
Positional Tools
2023
Infield Velocity
The athlete's maximum throwing velocity from an infield position in the given event year. Measured in miles per hour (MPH).
61.0
Hitting

Hitting

Pitching

2024
2023
2022
Fastball
Velocity Max
The maximum observed fastball velocity in the given event year. Measured in miles per hour (MPH).
91.5
Fastball
Velocity Avg
The average velocity for all pitches of this type in the given event year. Measured in miles per hour (MPH).
87.9
Fastball
Spin Rate Avg
The average rate of spin for all pitches of this type in the given event year. Measured in rotations per minute (RPM).
2014
Fastball
Spin Score Avg
The average Bauer Units value of all fastballs in the given event year. Bauer Units are calculated for each pitch by dividing Spin Rate by Velocity.
22.9
Fastball
Total Movement Avg
The average total non-gravity movement for all pitches of this type in the given event year. Measured in inches (in).
Curveball
Velocity Avg
The average velocity for all pitches of this type in the given event year. Measured in miles per hour (MPH).
77.5
Curveball
Spin Rate Avg
The average rate of spin for all pitches of this type in the given event year. Measured in rotations per minute (RPM).
2186
Curveball
Total Movement Avg
The average total non-gravity movement for all pitches of this type in the given event year. Measured in inches (in).
Changeup
Velocity Avg
The average velocity for all pitches of this type in the given event year. Measured in miles per hour (MPH).
76.4
Changeup
Spin Rate Avg
The average rate of spin for all pitches of this type in the given event year. Measured in rotations per minute (RPM).
1487
Changeup
Total Movement Avg
The average total non-gravity movement for all pitches of this type in the given event year. Measured in inches (in).
Slider
Velocity Avg
The average velocity for all pitches of this type in the given event year. Measured in miles per hour (MPH).
78.2
Slider
Spin Rate Avg
The average rate of spin for all pitches of this type in the given event year. Measured in rotations per minute (RPM).
2431
Slider
Total Movement Avg
The average total non-gravity movement for all pitches of this type in the given event year. Measured in inches (in).
Fastball
Velocity Max
The maximum observed fastball velocity in the given event year. Measured in miles per hour (MPH).
87.7
Fastball
Velocity Avg
The average velocity for all pitches of this type in the given event year. Measured in miles per hour (MPH).
87.0
Fastball
Spin Rate Avg
The average rate of spin for all pitches of this type in the given event year. Measured in rotations per minute (RPM).
2053
Fastball
Spin Score Avg
The average Bauer Units value of all fastballs in the given event year. Bauer Units are calculated for each pitch by dividing Spin Rate by Velocity.
23.6
Fastball
Total Movement Avg
The average total non-gravity movement for all pitches of this type in the given event year. Measured in inches (in).
Curveball
Velocity Avg
The average velocity for all pitches of this type in the given event year. Measured in miles per hour (MPH).
76.5
Curveball
Spin Rate Avg
The average rate of spin for all pitches of this type in the given event year. Measured in rotations per minute (RPM).
2469
Curveball
Total Movement Avg
The average total non-gravity movement for all pitches of this type in the given event year. Measured in inches (in).
Changeup
Velocity Avg
The average velocity for all pitches of this type in the given event year. Measured in miles per hour (MPH).
74.3
Changeup
Spin Rate Avg
The average rate of spin for all pitches of this type in the given event year. Measured in rotations per minute (RPM).
1626
Changeup
Total Movement Avg
The average total non-gravity movement for all pitches of this type in the given event year. Measured in inches (in).
Fastball
Velocity Max
The maximum observed fastball velocity in the given event year. Measured in miles per hour (MPH).
81.1
Fastball
Velocity Avg
The average velocity for all pitches of this type in the given event year. Measured in miles per hour (MPH).
79.9
Fastball
Spin Rate Avg
The average rate of spin for all pitches of this type in the given event year. Measured in rotations per minute (RPM).
1934
Fastball
Spin Score Avg
The average Bauer Units value of all fastballs in the given event year. Bauer Units are calculated for each pitch by dividing Spin Rate by Velocity.
24.2
Fastball
Total Movement Avg
The average total non-gravity movement for all pitches of this type in the given event year. Measured in inches (in).
Curveball
Velocity Avg
The average velocity for all pitches of this type in the given event year. Measured in miles per hour (MPH).
67.9
Curveball
Spin Rate Avg
The average rate of spin for all pitches of this type in the given event year. Measured in rotations per minute (RPM).
2511
Curveball
Total Movement Avg
The average total non-gravity movement for all pitches of this type in the given event year. Measured in inches (in).
Changeup
Velocity Avg
The average velocity for all pitches of this type in the given event year. Measured in miles per hour (MPH).
72.5
Changeup
Spin Rate Avg
The average rate of spin for all pitches of this type in the given event year. Measured in rotations per minute (RPM).
1404
Changeup
Total Movement Avg
The average total non-gravity movement for all pitches of this type in the given event year. Measured in inches (in).
MN Fall ID- Twin Cities
Oct 6, 2024
Trackman - Fastball
91.5
Velocity (max)
90.6 - 91.3
Velo Range
89.5
Eff Velocity (avg)
2,149
Spin Rate (max)
2,001
Spin Rate (avg)
IVB (max)
IVB (avg)
HM (max)
HM (avg)
Extension (avg)
Release Ht (avg)
Spin Score (max)
Zone %
Trackman - Slider
80.7
Velocity (max)
78.4 - 80.4
Velo Range
77.8
Eff Velocity (avg)
2,566
Spin Rate (max)
2,486
Spin Rate (avg)
IVB (max)
IVB (avg)
HM (max)
HM (avg)
Extension (avg)
Release Ht (avg)
Spin Score (max)
Zone %
Spin Efficiency % (avg)
Trackman - ChangeUp
77.5
Velocity (max)
76.7 - 77.4
Velo Range
76.2
Eff Velocity (avg)
1,318
Spin Rate (max)
1,178
Spin Rate (avg)
IVB (max)
IVB (avg)
HM (max)
HM (avg)
Extension (avg)
Release Ht (avg)
Spin Score (max)
Zone %
Spin Efficiency % (avg)
Future Games (Class of 2026/27)
Jul 24, 2024
Trackman - Fastball
89.6
Velocity (max)
85.8 - 88.8
Velo Range
86.4
Eff Velocity (avg)
2,110
Spin Rate (max)
1,914
Spin Rate (avg)
IVB (max)
IVB (avg)
HM (max)
HM (avg)
Extension (avg)
Release Ht (avg)
Spin Score (max)
Zone %
Trackman - Curveball
79.7
Velocity (max)
76.2 - 78.8
Velo Range
76.2
Eff Velocity (avg)
2,257
Spin Rate (max)
2,186
Spin Rate (avg)
IVB (max)
IVB (avg)
HM (max)
HM (avg)
Extension (avg)
Release Ht (avg)
Spin Score (max)
Zone %
Prep Baseball MN State Games (2025 Grads)
Jun 17, 2024
Trackman - Fastball
88.9
Velocity (max)
86.5 - 88.2
Velo Range
87.1
Eff Velocity (avg)
2,315
Spin Rate (max)
2,144
Spin Rate (avg)
IVB (max)
IVB (avg)
HM (max)
HM (avg)
Extension (avg)
Release Ht (avg)
Spin Score (max)
Zone %
Spin Efficiency % (avg)
Trackman - Slider
78.6
Velocity (max)
76.0 - 78.4
Velo Range
76.6
Eff Velocity (avg)
2,585
Spin Rate (max)
2,394
Spin Rate (avg)
IVB (max)
IVB (avg)
HM (max)
HM (avg)
Extension (avg)
Release Ht (avg)
Spin Score (max)
Zone %
Spin Efficiency % (avg)
Trackman - ChangeUp
66.1
Velocity (max)
64.6
Eff Velocity (avg)
1,486
Spin Rate (max)
1,486
Spin Rate (avg)
IVB (max)
IVB (avg)
HM (max)
HM (avg)
Extension (avg)
Release Ht (avg)
Spin Score (max)
Zone %
PBR MN Preseason All-State (Invite Only)
Mar 16, 2024
Trackman - Fastball
89.5
Velocity (max)
88.8 - 89.5
Velo Range
87.6
Eff Velocity (avg)
1,977
Spin Rate (max)
1,942
Spin Rate (avg)
IVB (max)
IVB (avg)
HM (max)
HM (avg)
Extension (avg)
Release Ht (avg)
Spin Score (max)
Zone %
Spin Efficiency % (avg)
Trackman - Slider
79.4
Velocity (max)
78.5 - 79.4
Velo Range
77.2
Eff Velocity (avg)
2,473
Spin Rate (max)
2,444
Spin Rate (avg)
IVB (max)
IVB (avg)
HM (max)
HM (avg)
Extension (avg)
Release Ht (avg)
Spin Score (max)
Trackman - ChangeUp
78.7
Velocity (max)
77.9 - 78.7
Velo Range
77.2
Eff Velocity (avg)
1,924
Spin Rate (max)
1,874
Spin Rate (avg)
IVB (max)
IVB (avg)
HM (max)
HM (avg)
Extension (avg)
Release Ht (avg)
Spin Score (max)
Zone %
Spin Efficiency % (avg)
PBR MN Fall ID- Twin Cities
Oct 8, 2023
Trackman - Fastball
87.7
Velocity (max)
86.6 - 87.5
Velo Range
85.7
Eff Velocity (avg)
2,107
Spin Rate (max)
2,053
Spin Rate (avg)
IVB (max)
IVB (avg)
HM (max)
HM (avg)
Extension (avg)
Release Ht (avg)
Spin Score (max)
Zone %
Trackman - Curveball
78.3
Velocity (max)
75.3 - 77.8
Velo Range
74.5
Eff Velocity (avg)
2,509
Spin Rate (max)
2,469
Spin Rate (avg)
IVB (max)
IVB (avg)
HM (max)
HM (avg)
Extension (avg)
Release Ht (avg)
Spin Score (max)
Zone %
Spin Efficiency % (avg)
Trackman - ChangeUp
75.0
Velocity (max)
73.1 - 75.0
Velo Range
73.1
Eff Velocity (avg)
1,701
Spin Rate (max)
1,626
Spin Rate (avg)
IVB (max)
IVB (avg)
HM (max)
HM (avg)
Extension (avg)
Release Ht (avg)
Spin Score (max)
Zone %
Spin Efficiency % (avg)
PBR MN Fall Underclass
Oct 2, 2022
Trackman - Fastball
81.1
Velocity (max)
78.7 - 81.1
Velo Range
79.7
Eff Velocity (avg)
2,060
Spin Rate (max)
1,934
Spin Rate (avg)
IVB (max)
IVB (avg)
HM (max)
HM (avg)
Extension (avg)
Release Ht (avg)
Spin Score (max)
Zone %
Trackman - Curveball
68.4
Velocity (max)
67.3 - 68.4
Velo Range
66.4
Eff Velocity (avg)
2,565
Spin Rate (max)
2,511
Spin Rate (avg)
IVB (max)
IVB (avg)
HM (max)
HM (avg)
Extension (avg)
Release Ht (avg)
Spin Score (max)
Zone %
Trackman - ChangeUp
73.4
Velocity (max)
71.8 - 73.2
Velo Range
73.2
Eff Velocity (avg)
1,462
Spin Rate (max)
1,404
Spin Rate (avg)
IVB (max)
IVB (avg)
HM (max)
HM (avg)
Extension (avg)
Release Ht (avg)
Spin Score (max)
Zone %
Pitch Scores
2024
2023
2022
Fastball
Hop+
A fastball with hop has a flat approach angle and visually jumps through the zone. When thrown up in the zone, it is more likely to generate a higher swing and miss average. Hop+ of 100 is MLB average.
Fastball
Sink+
A fastball with sink has low backspin and drops through the strike zone. When thrown down in the zone, it is more likely to generate a higher ground ball percentage and lower launch angle. Sink+ of 100 is MLB average.
Fastball
Rise+
A fastball with rise has a high percentage of backspin. When thrown up in the zone, it is more likely to generate a higher fly ball percentage. Rise+ of 100 is MLB average
Slider
Hammer+
A hammer breaking ball drops vertically with velocity through the zone, or 12-to-6 movement. Hammer+ of 100 is MLB average.
Slider
Sweep+
A sweeping breaking ball moves horizontally with velocity through the zone. Sweep+ of 100 is MLB average.
Fastball
Hop+
A fastball with hop has a flat approach angle and visually jumps through the zone. When thrown up in the zone, it is more likely to generate a higher swing and miss average. Hop+ of 100 is MLB average.
Fastball
Sink+
A fastball with sink has low backspin and drops through the strike zone. When thrown down in the zone, it is more likely to generate a higher ground ball percentage and lower launch angle. Sink+ of 100 is MLB average.
Fastball
Rise+
A fastball with rise has a high percentage of backspin. When thrown up in the zone, it is more likely to generate a higher fly ball percentage. Rise+ of 100 is MLB average
Curveball
Hammer+
A hammer breaking ball drops vertically with velocity through the zone, or 12-to-6 movement. Hammer+ of 100 is MLB average.
Curveball
Sweep+
A sweeping breaking ball moves horizontally with velocity through the zone. Sweep+ of 100 is MLB average.
Pitching Velos
2024
2023
2022
Fastball
Velocity Max
The maximum observed fastball velocity in the given event year. Measured in miles per hour (MPH).
91.0
Fastball
Velocity Avg
The average velocity for all pitches of this type in the given event year. Measured in miles per hour (MPH)
88.9
Curveball
Velocity Avg
The average velocity for all pitches of this type in the given event year. Measured in miles per hour (MPH)
78.5
Changeup
Velocity Avg
The average velocity for all pitches of this type in the given event year. Measured in miles per hour (MPH)
76.1
Slider
Velocity Avg
The average velocity for all pitches of this type in the given event year. Measured in miles per hour (MPH)
78.3
Fastball
Velocity Max
The maximum observed fastball velocity in the given event year. Measured in miles per hour (MPH).
88.0
Fastball
Velocity Avg
The average velocity for all pitches of this type in the given event year. Measured in miles per hour (MPH)
87.5
Curveball
Velocity Avg
The average velocity for all pitches of this type in the given event year. Measured in miles per hour (MPH)
76.5
Changeup
Velocity Avg
The average velocity for all pitches of this type in the given event year. Measured in miles per hour (MPH)
74.0
Fastball
Velocity Max
The maximum observed fastball velocity in the given event year. Measured in miles per hour (MPH).
81.0
Fastball
Velocity Avg
The average velocity for all pitches of this type in the given event year. Measured in miles per hour (MPH)
80.0
Curveball
Velocity Avg
The average velocity for all pitches of this type in the given event year. Measured in miles per hour (MPH)
67.5
Changeup
Velocity Avg
The average velocity for all pitches of this type in the given event year. Measured in miles per hour (MPH)
72.5
Game Performance

Visual Edge

Pitch Ai

Notes
News
Comments
Draft Reports
Contact
Premium Content Area
To unlock contact information, you need to purchase a ScoutPLUS subscription.
Purchase Subscription OR
Login
Physical
2024
Grip Strgth (LH)
Grip strength is a measure of a players bat control and ability to transfer power and speed during impact, measured in pounds of force generated; collected with elbow bent at 90 degrees.
Grip Strgth (RH)
Grip strength is a measure of a players bat control and ability to transfer power and speed during impact, measured in pounds of force generated; collected with elbow bent at 90 degrees.


 Sign in to view rankings
Positional Profile: RHP/OF
Body: 6-2, 192-pounds.
Delivery: Hybrid start, high tempo to leg lift, small hip coil, fast hip rotation lands inline.
Arm Action: RH. Long arm swing, shoulder tilt back, hand swings down and behind, works back to up, high 3/4 slot
FB: T91, 91-91 mph. T2149, 2001 average rpm.
SL: 78-80 mph. T2566, 2486 average rpm.
CH: 77-77 mph. T1318, 1178 average rpm.
Positional Profile: RHP/OF
Body: 6-1, 192-pounds.
Delivery: Hybrid start, high tempo to leg lift, small hip coil, lands inline.
Arm Action: RH
FB: T89, 87-88 mph. T2315, 2144 average rpm.
SL: 76-78 mph. T2585, 2394 average rpm.
CH: 66-66 mph. T1486, 1486 average rpm.
Positional Profile: RHP/OF
Body: 6-2, 185-pounds.
Delivery: Full hybrid start, up tempo, small rocker step back, high leg swing up, coils at top, stays over the back leg, lands inline
Arm Action: RH. Long arm swing, high hand break, shoulder tilt back, hand swings down and behind, bows back, high 3/4 slot
FB: T89, 89-89 mph. T1977, 1942 average rpm.
SL: 79-79 mph. T2473, 2444 average rpm.
CH: 78-79 mph. T1924, 1874 average rpm.
Positional Profile: RHP/OF Follow on Mound
Body: 6-1, 170-pounds.
Delivery: Hybrid start, quick tempo, small steps, rocks back and big leg swing up, gets over back leg, works aggressively down the mound
Arm Action: RH. Long arm action, hand works down from break, shoulder tilt up, horizontal arm, shoulders clear to high 3/4 slot
FB: T88, 87-88 mph. Has life T2107, 2053 average rpm.
CB: 75-78 mph. Sharp break T2509, 2469 average rpm.
CH: 73-75 mph. Good movement when down T1701, 1626 average rpm.
Body: 5-11, 145-pounds.
Delivery: Shoulder width balanced start. Up tempo delivery. Moves across rubber, high/coiled balance position, lands closed.
Arm Action: RH. Long arm swing, shoulder stay closed, hands gets above shoulder, 3/4 release.
FB: T81.1, 79-81 mph. Late arm side life T2060, 1934 average rpm.
CB: 67-68 mph. Good 10/4 break T2565, 2511 average rpm.
CH: 72-73 mph. Fade, occasional sink T1462, 1404 average rpm.
Positional Profile: RHP/OF
Body: 5-11, 145-pounds.
Delivery: Shoulder width balanced start. Up tempo delivery. Moves across rubber, high/coiled balance position, lands closed.
Arm Action: RH. Long arm swing, shoulder stay closed, hands gets above shoulder, 3/4 release.
FB: T81.1, 79-81 mph. Late arm side life T2060, 1934 average rpm.
CB: 67-68 mph. Good 10/4 break T2565, 2511 average rpm.
CH: 72-73 mph. Fade, occasional sink T1462, 1404 average rpm.