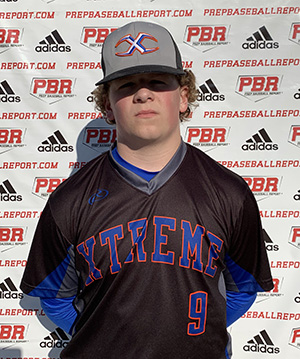
CLASS OF 2023
C
3B
Carson
McCaleb
Mineral Area JC
Timberland (HS) • MO
5' 9" • 195LBS
S/R • 20yr 3mo
Travel Team: Memphis Tigers
Timberland (HS) • MO
5' 9" • 195LBS
S/R • 20yr 3mo
Travel Team: Memphis Tigers
Rankings
2023 National
Rankings available to Premium Subscriber
2023 State
Rankings available to Premium Subscriber
Commitment
Best Of Stats
23.1
Hand Speed (max)
9/27/22
78.7
Bat Speed (max)
9/27/22
18.7
Rot. Acc (max)
9/27/22
65
Hard Hit %
10/15/24
100.1
Exit Velocity (max)
10/15/24
91.4
Exit Velocity (avg)
10/15/24
369
Distance (max)
9/27/22
75
Sweet Spot %
10/15/24
7.13
60
9/27/22
-
30-yd
-
10-yd
-
Run speed (max)
79
INF Velo
9/27/22
-
OF Velo
79
C Velo
10/15/24
1.86 - 1.90
Pop Time
10/15/24
Positional Tools
2024
2022
2021
2020
Pop Time
The athlete's fastest pop time in the given event year. Measured from glove to glove, in seconds (s).
1.86 - 1.90
Catcher Velocity
The athlete's maximum throwing velocity from the catcher position in the given event year. Measured in miles per hour (MPH).
79.0
60 Yard Dash
The athlete's fastest 60-yard dash time in the given event year. Measured in seconds (s)
7.13
Pop Time
The athlete's fastest pop time in the given event year. Measured from glove to glove, in seconds (s).
1.88 - 2.03
Catcher Velocity
The athlete's maximum throwing velocity from the catcher position in the given event year. Measured in miles per hour (MPH).
75.0
Infield Velocity
The athlete's maximum throwing velocity from an infield position in the given event year. Measured in miles per hour (MPH).
79.0
Power / Speed Score
A simple calculation that divides the athlete’s Exit Velocity Max by the athlete’s 60 Yard Dash time for the given event year. For example, 98 MPH / 7.00s = 14.00.
13.8
Home to First
The athlete's fastest home-to-first time in the given event year. Measured from bat-on-ball to foot-on-bag, in seconds (s).
3.94
Pop Time
The athlete's fastest pop time in the given event year. Measured from glove to glove, in seconds (s).
2.02 - 2.06
Catcher Velocity
The athlete's maximum throwing velocity from the catcher position in the given event year. Measured in miles per hour (MPH).
74.0
60 Yard Dash
The athlete's fastest 60-yard dash time in the given event year. Measured in seconds (s)
7.27
Pop Time
The athlete's fastest pop time in the given event year. Measured from glove to glove, in seconds (s).
2.08 - 2.12
Catcher Velocity
The athlete's maximum throwing velocity from the catcher position in the given event year. Measured in miles per hour (MPH).
73.0
Power / Speed Score
A simple calculation that divides the athlete’s Exit Velocity Max by the athlete’s 60 Yard Dash time for the given event year. For example, 98 MPH / 7.00s = 14.00.
12.4
2022 Battle for the Arch (Invite-Only)
Sep 27, 2022
Position
7.13
60-yard
1.94 - 2.03
Pop Time
79
INF Velo
74
C Velo
99
Exit Velo
Power Speed Score
Hitting

2024
2022
2020
Exit Velocity Max
The highest exit velocity of any batted ball in the given event year. Measured in miles per hour (MPH).
100.1
Exit Velocity Avg
Average exit velocity of all batted balls in the given event year. Measured in miles per hour (MPH).
91.4
Distance Max
The highest flight distance of any batted ball in the given event year. Measured in feet (ft).
332
Distance Avg
Average flight distance of all batted balls in the given event year. Measured in feet (ft).
227
Launch Angle Avg
Average launch angle of all batted balls in the given event year. Measured in degrees.
19.8
Hard Hit %
Percentage of batted balls with exit velocities over 95 MPH in the given event year.
Sweet Spot %
Percentage of batted balls in the given event year with a launch angle between 8° and 32°.
Line Drive %
Percentage of batted balls with launch angles between 10 and 25 degrees in the given event year.
Fly Ball %
Percentage of batted balls with launch angles between 25 and 50 degrees in the given event year.
Ground Ball %
Percentage of batted balls with launch angles below 10 degrees in the given event year.
Exit Velocity Max
The highest exit velocity of any batted ball in the given event year. Measured in miles per hour (MPH).
98.6
Exit Velocity Avg
Average exit velocity of all batted balls in the given event year. Measured in miles per hour (MPH).
87.4
Distance Max
The highest flight distance of any batted ball in the given event year. Measured in feet (ft).
369
Distance Avg
Average flight distance of all batted balls in the given event year. Measured in feet (ft).
219
Launch Angle Avg
Average launch angle of all batted balls in the given event year. Measured in degrees.
21.8
Hard Hit %
Percentage of batted balls with exit velocities over 95 MPH in the given event year.
Sweet Spot %
Percentage of batted balls in the given event year with a launch angle between 8° and 32°.
Line Drive %
Percentage of batted balls with launch angles between 10 and 25 degrees in the given event year.
Fly Ball %
Percentage of batted balls with launch angles between 25 and 50 degrees in the given event year.
Ground Ball %
Percentage of batted balls with launch angles below 10 degrees in the given event year.
Exit Velocity Max
The highest exit velocity of any batted ball in the given event year. Measured in miles per hour (MPH).
89.9
Exit Velocity Avg
Average exit velocity of all batted balls in the given event year. Measured in miles per hour (MPH).
80.4
Distance Max
The highest flight distance of any batted ball in the given event year. Measured in feet (ft).
243
Distance Avg
Average flight distance of all batted balls in the given event year. Measured in feet (ft).
105
Launch Angle Avg
Average launch angle of all batted balls in the given event year. Measured in degrees.
6.5
Hard Hit %
Percentage of batted balls with exit velocities over 95 MPH in the given event year.
Sweet Spot %
Percentage of batted balls in the given event year with a launch angle between 8° and 32°.
Line Drive %
Percentage of batted balls with launch angles between 10 and 25 degrees in the given event year.
Fly Ball %
Percentage of batted balls with launch angles between 25 and 50 degrees in the given event year.
Ground Ball %
Percentage of batted balls with launch angles below 10 degrees in the given event year.
Mineral Area College Scout Day
Oct 15, 2024
Trackman - Hitting
100.1
Exit Velocity (max)
91.4
Exit Velocity (avg)
227
Distance (avg)
332
Distance (max)
Hard Hit %
Sweet Spot %
Line Drive %
Fly Ball %
Ground Ball %
2022 Battle for the Arch (Invite-Only)
Sep 27, 2022
Trackman - Hitting
98.6
Exit Velocity (max)
87.4
Exit Velocity (avg)
219
Distance (avg)
369
Distance (max)
Hard Hit %
Sweet Spot %
Line Drive %
Fly Ball %
Ground Ball %
St. Louis Open
Oct 25, 2020
Trackman - Hitting
89.9
Exit Velocity (max)
80.4
Exit Velocity (avg)
105
Distance (avg)
243
Distance (max)
Sweet Spot %
Line Drive %
Fly Ball %
Ground Ball %
Hitting

2022
2020
Hand Speed Max
The highest Peak Hand Speed of any swing in the given event year.
23.1
Hand Speed Avg
The average Peak Hand Speed for all swings in the given event year.
20.5
Bat Speed Max
The highest Bat Speed of any swing in the given event year.
78.7
Bat Speed Avg
The average Bat Speed for all swings in the given event year.
73.6
Rotational Acceleration Max
The highest Rotational Acceleration of any swing in the given event year.
Rotational Acceleration Avg
The average Rotational Acceleration for all swings in the given event year.
On-Plane Efficiency Max
The highest On-Plane Efficiency of any swing in the given event year.
On-Plane Efficiency Avg
The average On-Plane Efficiency for all swings in the given event year.
Hand Speed Max
The highest Peak Hand Speed of any swing in the given event year.
21.1
Hand Speed Avg
The average Peak Hand Speed for all swings in the given event year.
20.0
Bat Speed Max
The highest Bat Speed of any swing in the given event year.
69.9
Bat Speed Avg
The average Bat Speed for all swings in the given event year.
63.3
Rotational Acceleration Max
The highest Rotational Acceleration of any swing in the given event year.
Rotational Acceleration Avg
The average Rotational Acceleration for all swings in the given event year.
On-Plane Efficiency Max
The highest On-Plane Efficiency of any swing in the given event year.
On-Plane Efficiency Avg
The average On-Plane Efficiency for all swings in the given event year.
2022 Battle for the Arch (Invite-Only)
Sep 27, 2022
Blast - Hitting
23.1
Hand Speed (max)
20.5
Hand Speed (avg)
78.7
Bat Speed (max)
73.6
Bat Speed (avg)
Rot. Acc (max)
Rot. Acc (avg)
On Plane Eff (avg)
MaxOnPlaneEfficiency
St. Louis Open
Oct 25, 2020
Blast - Hitting
21.1
Hand Speed (max)
20.0
Hand Speed (avg)
69.9
Bat Speed (max)
63.3
Bat Speed (avg)
Rot. Acc (max)
Rot. Acc (avg)
On Plane Eff (avg)
MaxOnPlaneEfficiency
Pitching

Pitch Scores
Pitching Velos
Game Performance

Visual Edge

2022
Edge Score
The highest Edge Score within the given year. Edge Score is a comprehensive score that takes the core-six visual skills into account, providing an assessment of an athlete’s overall visual ability.
72.74
Pitch Ai

Notes
News
- Preseason High School Preview: Timberland - Mar 9, 2023
- PBR Missouri Best of 2022: Max Exit Velocities - Dec 5, 2022
- PBR MO Uncommitted Spotlight: Carson McCaleb - Nov 1, 2022
- Battle for The Arch: Quick Hits - Sep 28, 2022
- St. Louis Top Prospect Games Upperclass: Quick Hits - Jun 27, 2022
- Midwest Premier Super 17 (Member): Preview Story - Jun 22, 2022
- Rawlings Tigers Scout Day - Jan 27, 2021
Comments
Draft Reports
Contact
Premium Content Area
To unlock contact information, you need to purchase a ScoutPLUS subscription.
Purchase Subscription OR
Login


 Sign in to view rankings
C/INF Carson McCaleb (Timberland, 2023) had one of the more impressive showings on the day for Team Missouri. A strong 5-foot-9, 195-pound switch hitter, McCaleb generated easy juice from both sides of the plate, barreling up multiple balls at 95+ mph while peaking at 98.6 mph. His ability to repeat his swing from both sides of the plate is evident and so is his knack for the barrel, nearly leading the event in hard-hit percentage (56%). McCaleb is a quality receiver behind the plate as well, working down-to-up with his glove and utilizing his strong wrists to stick the baseball. He recorded the event’s quickest pop time (1.94) and was accurate on the bag throughout his defensive workout. McCaleb is one of the top uncommitted prospects in Missouri’s senior class.
McCaleb’s brother, switch-hitting C Carson McCaleb (Timberland, 2023) was also a winner from this event. Built at 5-foot-9, 190-pounds with compact strength, McCaleb repeated a short, level swing from both sides of the plate in BP, averaging 85.3 mph off the barrel throughout. He brought a ‘hitterish’ look to the box, staying direct to the baseball without much added movement. Defensively, McCaleb popped 1.88-to-2.01 to the bag and topped at 75 mph from the crouch.
Positional Profile: C/3B
Body: 5-foot-9, 165-pounds. Athletic, developing frame.
Hit: SH. Balanced stance, smooth load with rhythm in hands, maintains balance with some feel for the barrel. Line-drive hitter, up the middle approach, flashed some pull side power from the left side.
Power: 85 mph exit velocity from the tee. Quick hands.
Arm: RH. C - 73 mph. Short arm action, over-the-top release slot with accuracy on throw downs.
Defense: 2.08-2.12 pop times. Strong receiver and blocker. Quiet actions behind plate, clean footwork and exchanges.
Run: 7.27 runner in the 60.