CLASS OF 2023
RHP
RHP
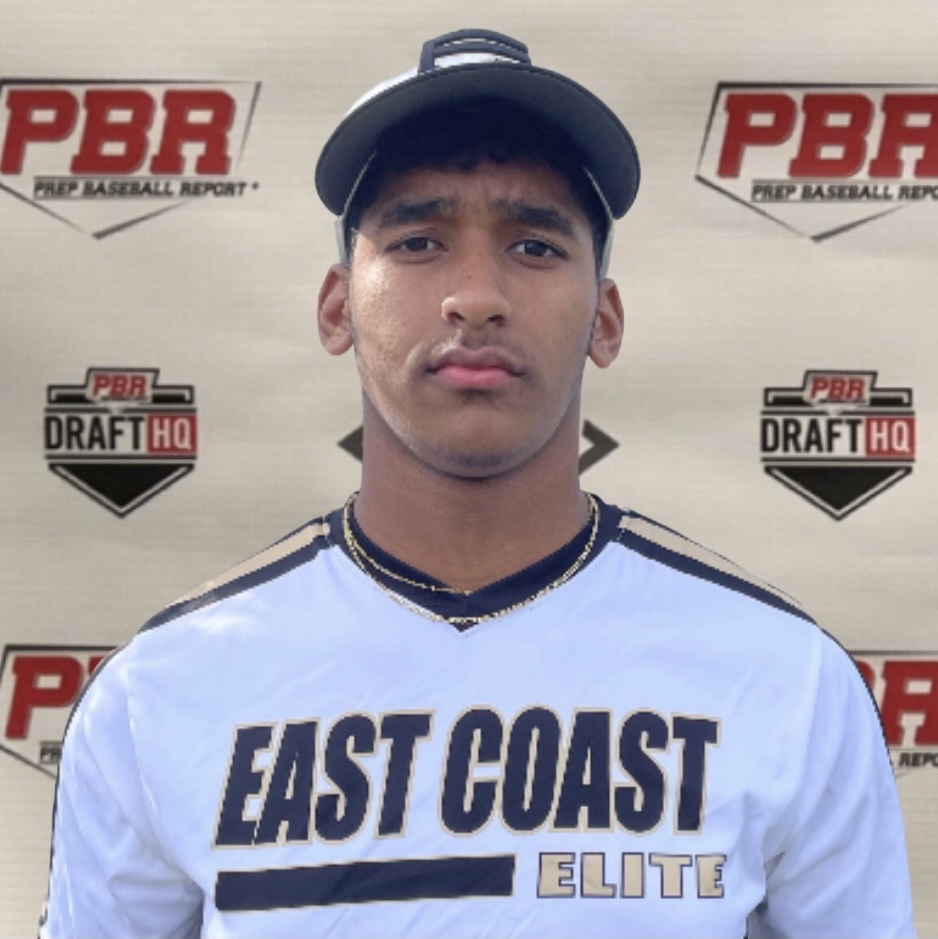
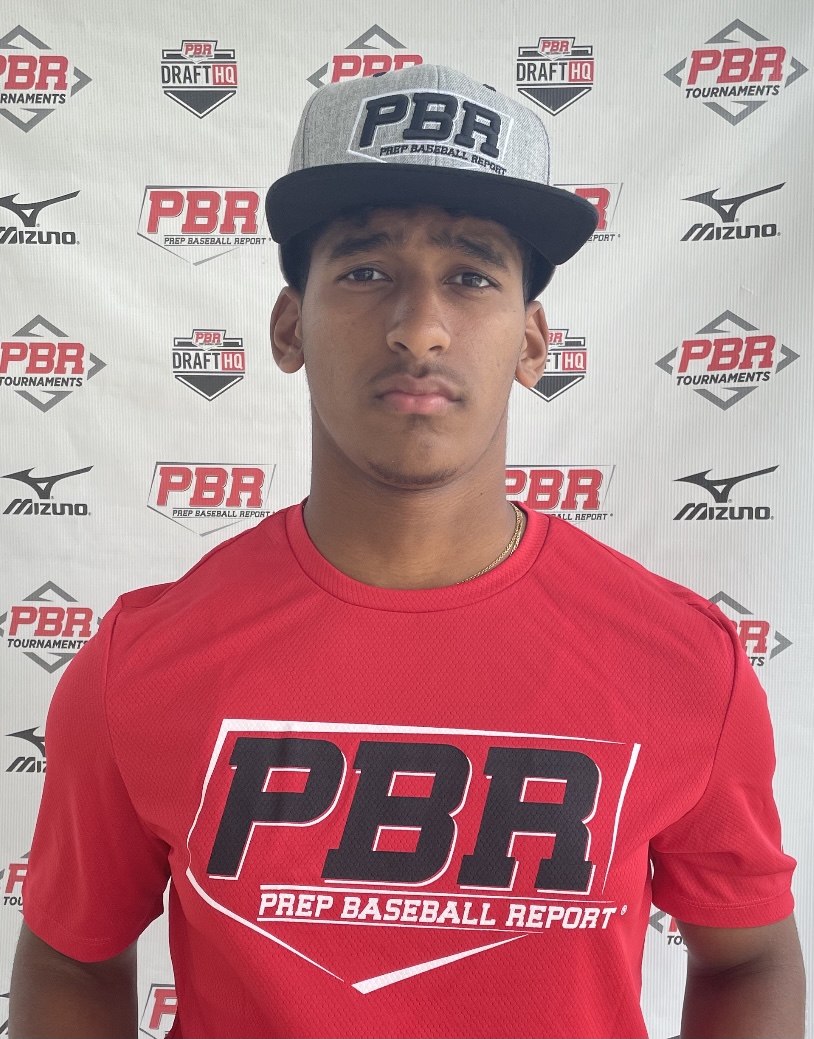
Christian
De La Cruz
Manhattan
Combine Academy NC (HS) • NY
5' 11" • 185LBS
R/R • 20yr 5mo
Travel Team: Real Ballers National Team 2023
Combine Academy NC (HS) • NY
5' 11" • 185LBS
R/R • 20yr 5mo
Travel Team: Real Ballers National Team 2023
Rankings
2023 National
Rankings available to Premium Subscriber
2023 State
Rankings available to Premium Subscriber
Commitment
Best Of Stats
Fastball
92.1
Velocity (max)
9/27/22
90.1 - 92
Velo Range
9/27/22
2259
Spin Rate (avg)
9/27/22
Changeup
84.6 - 86.5
Velo Range
9/27/22
2148
Spin Rate (avg)
9/27/22
Curveball
73.1 - 75
Velo Range
9/27/22
2473
Spin Rate (avg)
9/27/22
Slider
76.2 - 77.7
Velo Range
9/27/22
2354
Spin Rate (avg)
9/27/22
83
Exit Velocity (max)
8/28/20
69.9
Exit Velocity (avg)
8/28/20
287
Distance (max)
8/28/20
57
Sweet Spot %
8/28/20
6.75
60
8/28/20
-
30-yd
-
10-yd
-
Run speed (max)
Positional Tools
2021
2020
60 Yard Dash
The athlete's fastest 60-yard dash time in the given event year. Measured in seconds (s)
7.28
60 Yard Dash
The athlete's fastest 60-yard dash time in the given event year. Measured in seconds (s)
6.75
Power / Speed Score
A simple calculation that divides the athlete’s Exit Velocity Max by the athlete’s 60 Yard Dash time for the given event year. For example, 98 MPH / 7.00s = 14.00.
12.3
Hitting

2020
Exit Velocity Max
The highest exit velocity of any batted ball in the given event year. Measured in miles per hour (MPH).
83.0
Exit Velocity Avg
Average exit velocity of all batted balls in the given event year. Measured in miles per hour (MPH).
69.9
Distance Max
The highest flight distance of any batted ball in the given event year. Measured in feet (ft).
287
Distance Avg
Average flight distance of all batted balls in the given event year. Measured in feet (ft).
220
Launch Angle Avg
Average launch angle of all batted balls in the given event year. Measured in degrees.
33.3
Hard Hit %
Percentage of batted balls with exit velocities over 95 MPH in the given event year.
Sweet Spot %
Percentage of batted balls in the given event year with a launch angle between 8° and 32°.
Line Drive %
Percentage of batted balls with launch angles between 10 and 25 degrees in the given event year.
Fly Ball %
Percentage of batted balls with launch angles between 25 and 50 degrees in the given event year.
Ground Ball %
Percentage of batted balls with launch angles below 10 degrees in the given event year.
2020 East Coast Elite Scout Day
Aug 28, 2020
Trackman - Hitting
83.0
Exit Velocity (max)
69.9
Exit Velocity (avg)
220
Distance (avg)
287
Distance (max)
Sweet Spot %
Line Drive %
Fly Ball %
Hitting

Pitching

2022
2021
2020
Fastball
Velocity Max
The maximum observed fastball velocity in the given event year. Measured in miles per hour (MPH).
92.1
Fastball
Velocity Avg
The average velocity for all pitches of this type in the given event year. Measured in miles per hour (MPH).
91.1
Fastball
Spin Rate Avg
The average rate of spin for all pitches of this type in the given event year. Measured in rotations per minute (RPM).
2259
Fastball
Spin Score Avg
The average Bauer Units value of all fastballs in the given event year. Bauer Units are calculated for each pitch by dividing Spin Rate by Velocity.
24.8
Fastball
Total Movement Avg
The average total non-gravity movement for all pitches of this type in the given event year. Measured in inches (in).
Curveball
Velocity Avg
The average velocity for all pitches of this type in the given event year. Measured in miles per hour (MPH).
74.0
Curveball
Spin Rate Avg
The average rate of spin for all pitches of this type in the given event year. Measured in rotations per minute (RPM).
2473
Curveball
Total Movement Avg
The average total non-gravity movement for all pitches of this type in the given event year. Measured in inches (in).
Changeup
Velocity Avg
The average velocity for all pitches of this type in the given event year. Measured in miles per hour (MPH).
85.6
Changeup
Spin Rate Avg
The average rate of spin for all pitches of this type in the given event year. Measured in rotations per minute (RPM).
2148
Slider
Velocity Avg
The average velocity for all pitches of this type in the given event year. Measured in miles per hour (MPH).
77.0
Slider
Spin Rate Avg
The average rate of spin for all pitches of this type in the given event year. Measured in rotations per minute (RPM).
2354
Slider
Total Movement Avg
The average total non-gravity movement for all pitches of this type in the given event year. Measured in inches (in).
Fastball
Velocity Max
The maximum observed fastball velocity in the given event year. Measured in miles per hour (MPH).
90.7
Fastball
Velocity Avg
The average velocity for all pitches of this type in the given event year. Measured in miles per hour (MPH).
86.5
Fastball
Spin Rate Avg
The average rate of spin for all pitches of this type in the given event year. Measured in rotations per minute (RPM).
2123
Fastball
Spin Score Avg
The average Bauer Units value of all fastballs in the given event year. Bauer Units are calculated for each pitch by dividing Spin Rate by Velocity.
24.6
Fastball
Total Movement Avg
The average total non-gravity movement for all pitches of this type in the given event year. Measured in inches (in).
Curveball
Velocity Avg
The average velocity for all pitches of this type in the given event year. Measured in miles per hour (MPH).
69.0
Curveball
Spin Rate Avg
The average rate of spin for all pitches of this type in the given event year. Measured in rotations per minute (RPM).
2368
Curveball
Total Movement Avg
The average total non-gravity movement for all pitches of this type in the given event year. Measured in inches (in).
Changeup
Velocity Avg
The average velocity for all pitches of this type in the given event year. Measured in miles per hour (MPH).
80.0
Changeup
Spin Rate Avg
The average rate of spin for all pitches of this type in the given event year. Measured in rotations per minute (RPM).
1708
Changeup
Total Movement Avg
The average total non-gravity movement for all pitches of this type in the given event year. Measured in inches (in).
Fastball
Velocity Max
The maximum observed fastball velocity in the given event year. Measured in miles per hour (MPH).
87.6
Fastball
Velocity Avg
The average velocity for all pitches of this type in the given event year. Measured in miles per hour (MPH).
86.7
Fastball
Spin Rate Avg
The average rate of spin for all pitches of this type in the given event year. Measured in rotations per minute (RPM).
2147
Fastball
Spin Score Avg
The average Bauer Units value of all fastballs in the given event year. Bauer Units are calculated for each pitch by dividing Spin Rate by Velocity.
24.8
Fastball
Total Movement Avg
The average total non-gravity movement for all pitches of this type in the given event year. Measured in inches (in).
Curveball
Velocity Avg
The average velocity for all pitches of this type in the given event year. Measured in miles per hour (MPH).
72.7
Curveball
Spin Rate Avg
The average rate of spin for all pitches of this type in the given event year. Measured in rotations per minute (RPM).
2402
Curveball
Total Movement Avg
The average total non-gravity movement for all pitches of this type in the given event year. Measured in inches (in).
Changeup
Velocity Avg
The average velocity for all pitches of this type in the given event year. Measured in miles per hour (MPH).
83.8
Changeup
Spin Rate Avg
The average rate of spin for all pitches of this type in the given event year. Measured in rotations per minute (RPM).
1920
2022 Metro Scout Day
Sep 27, 2022
Trackman - Fastball
92.1
Velocity (max)
90.1 - 92.0
Velo Range
89.5
Eff Velocity (avg)
2,356
Spin Rate (max)
2,259
Spin Rate (avg)
IVB (max)
IVB (avg)
HM (max)
HM (avg)
Extension (avg)
Release Ht (avg)
Spin Score (max)
Zone %
Trackman - Curveball
75.3
Velocity (max)
73.1 - 75.0
Velo Range
71.5
Eff Velocity (avg)
2,533
Spin Rate (max)
2,473
Spin Rate (avg)
IVB (max)
IVB (avg)
HM (max)
HM (avg)
Extension (avg)
Release Ht (avg)
Spin Score (max)
Trackman - Slider
77.7
Velocity (max)
76.2 - 77.7
Velo Range
73.4
Eff Velocity (avg)
2,354
Spin Rate (max)
2,354
Spin Rate (avg)
IVB (max)
IVB (avg)
HM (max)
HM (avg)
Extension (avg)
Release Ht (avg)
Spin Score (max)
Trackman - ChangeUp
86.5
Velocity (max)
84.6 - 86.5
Velo Range
83.7
Eff Velocity (avg)
2,148
Spin Rate (max)
2,148
Spin Rate (avg)
Extension (avg)
Release Ht (avg)
Spin Score (max)
2021 East Coast Elite Scout Day
Aug 15, 2021
Trackman - Fastball
86.8
Velocity (max)
84.6 - 86.2
Velo Range
84.7
Eff Velocity (avg)
2,153
Spin Rate (max)
2,083
Spin Rate (avg)
IVB (max)
IVB (avg)
HM (max)
HM (avg)
Extension (avg)
Release Ht (avg)
Spin Score (max)
Zone %
Trackman - Curveball
67.7
Velocity (max)
64.4 - 67.7
Velo Range
64.0
Eff Velocity (avg)
2,411
Spin Rate (max)
2,360
Spin Rate (avg)
IVB (max)
IVB (avg)
HM (max)
HM (avg)
Extension (avg)
Release Ht (avg)
Spin Score (max)
Zone %
Trackman - ChangeUp
78.5
Velocity (max)
76.0 - 78.4
Velo Range
75.8
Eff Velocity (avg)
1,850
Spin Rate (max)
1,751
Spin Rate (avg)
IVB (max)
IVB (avg)
HM (max)
HM (avg)
Extension (avg)
Release Ht (avg)
Spin Score (max)
2021 NYS Games (Session 2)
Jun 30, 2021
Trackman - Fastball
87.5
Velocity (max)
84.6 - 86.6
Velo Range
85.0
Eff Velocity (avg)
2,289
Spin Rate (max)
2,123
Spin Rate (avg)
IVB (max)
IVB (avg)
HM (max)
HM (avg)
Extension (avg)
Release Ht (avg)
Spin Score (max)
Zone %
Trackman - Curveball
71.1
Velocity (max)
67.8 - 70.9
Velo Range
67.2
Eff Velocity (avg)
2,474
Spin Rate (max)
2,385
Spin Rate (avg)
IVB (max)
IVB (avg)
HM (max)
HM (avg)
Extension (avg)
Release Ht (avg)
Spin Score (max)
Zone %
Trackman - ChangeUp
79.9
Velocity (max)
1,468
Spin Rate (max)
1,468
Spin Rate (avg)
Extension (avg)
Release Ht (avg)
Spin Score (max)
2021 Preseason All-State Pitching - Downstate
Mar 28, 2021
Trackman - Fastball
90.7
Velocity (max)
88.4 - 90.4
Velo Range
88.2
Eff Velocity (avg)
2,321
Spin Rate (max)
2,205
Spin Rate (avg)
IVB (max)
IVB (avg)
HM (max)
HM (avg)
Extension (avg)
Release Ht (avg)
Spin Score (max)
Zone %
Trackman - Curveball
75.2
Velocity (max)
67.8 - 73.5
Velo Range
67.4
Eff Velocity (avg)
2,453
Spin Rate (max)
2,332
Spin Rate (avg)
IVB (max)
IVB (avg)
HM (max)
HM (avg)
Extension (avg)
Release Ht (avg)
Spin Score (max)
Zone %
Trackman - ChangeUp
85.4
Velocity (max)
79.7 - 84.4
Velo Range
80.6
Eff Velocity (avg)
2,025
Spin Rate (max)
1,793
Spin Rate (avg)
IVB (max)
IVB (avg)
HM (max)
HM (avg)
Extension (avg)
Release Ht (avg)
Spin Score (max)
Zone %
Area Code ID Series: New Jersey
Mar 7, 2021
Trackman - Fastball
89.3
Velocity (max)
88.6 - 89.3
Velo Range
2,127
Spin Rate (max)
2,053
Spin Rate (avg)
IVB (max)
IVB (avg)
HM (max)
HM (avg)
Extension (avg)
Release Ht (avg)
Spin Score (max)
Trackman - Curveball
71.3
Velocity (max)
69.3 - 71.3
Velo Range
2,435
Spin Rate (max)
2,373
Spin Rate (avg)
IVB (max)
IVB (avg)
HM (max)
HM (avg)
Extension (avg)
Release Ht (avg)
Spin Score (max)
Zone %
Trackman - ChangeUp
82.8
Velocity (max)
82.0 - 82.8
Velo Range
1,516
Spin Rate (max)
1,508
Spin Rate (avg)
IVB (max)
IVB (avg)
HM (max)
HM (avg)
Extension (avg)
Release Ht (avg)
Spin Score (max)
Zone %
2020 East Coast Elite Scout Day
Aug 28, 2020
Trackman - Fastball
87.6
Velocity (max)
85.7 - 87.6
Velo Range
86.6
Eff Velocity (avg)
2,207
Spin Rate (max)
2,147
Spin Rate (avg)
IVB (max)
IVB (avg)
HM (max)
HM (avg)
Extension (avg)
Release Ht (avg)
Spin Score (max)
Zone %
Trackman - Curveball
74.3
Velocity (max)
71.8 - 73.8
Velo Range
72.1
Eff Velocity (avg)
2,487
Spin Rate (max)
2,402
Spin Rate (avg)
IVB (max)
IVB (avg)
HM (max)
HM (avg)
Extension (avg)
Release Ht (avg)
Spin Score (max)
Zone %
Trackman - ChangeUp
84.4
Velocity (max)
83.1 - 84.4
Velo Range
1,920
Spin Rate (max)
1,920
Spin Rate (avg)
Extension (avg)
Release Ht (avg)
Spin Score (max)
Pitch Scores
2021
Fastball
Hop+
A fastball with hop has a flat approach angle and visually jumps through the zone. When thrown up in the zone, it is more likely to generate a higher swing and miss average. Hop+ of 100 is MLB average.
Fastball
Sink+
A fastball with sink has low backspin and drops through the strike zone. When thrown down in the zone, it is more likely to generate a higher ground ball percentage and lower launch angle. Sink+ of 100 is MLB average.
Fastball
Rise+
A fastball with rise has a high percentage of backspin. When thrown up in the zone, it is more likely to generate a higher fly ball percentage. Rise+ of 100 is MLB average
Curveball
Hammer+
A hammer breaking ball drops vertically with velocity through the zone, or 12-to-6 movement. Hammer+ of 100 is MLB average.
Curveball
Sweep+
A sweeping breaking ball moves horizontally with velocity through the zone. Sweep+ of 100 is MLB average.
Pitching Velos
2021
2020
Fastball
Velocity Max
The maximum observed fastball velocity in the given event year. Measured in miles per hour (MPH).
91.0
Fastball
Velocity Avg
The average velocity for all pitches of this type in the given event year. Measured in miles per hour (MPH)
87.1
Curveball
Velocity Avg
The average velocity for all pitches of this type in the given event year. Measured in miles per hour (MPH)
68.6
Changeup
Velocity Avg
The average velocity for all pitches of this type in the given event year. Measured in miles per hour (MPH)
80.2
Fastball
Velocity Max
The maximum observed fastball velocity in the given event year. Measured in miles per hour (MPH).
88.0
Fastball
Velocity Avg
The average velocity for all pitches of this type in the given event year. Measured in miles per hour (MPH)
87.0
Curveball
Velocity Avg
The average velocity for all pitches of this type in the given event year. Measured in miles per hour (MPH)
73.0
Changeup
Velocity Avg
The average velocity for all pitches of this type in the given event year. Measured in miles per hour (MPH)
83.5
Game Performance

Visual Edge

Pitch Ai

Notes
News
Comments
Draft Reports
Contact
Premium Content Area
To unlock contact information, you need to purchase a ScoutPLUS subscription.
Purchase Subscription OR
Login


 Sign in to view rankings
Physical: Strong, durable 5-foot-11, 185lb frame with advanced feel and athleticism present.
Pitching: RHP - Started off the far left side of the rubber with the left foot in front of right. Momentum gaining pace, creating some hip-coil and hiding the baseball at the top of the stack. Worked down the slope with good separation and arm talent from a loose, H ¾ slot. The FB entered at 85-88 mph at 2122rpms, able to carry on occasion above the letters at a 42% zone rate (via Trackman). Mixed in a two-plane 69-71 mph CB with late depth on its way to the plate, missing barrels when commanded for strikes. Then added a developing 77-80 mph CH with good sell and killed spin.
Physical: Athletic 5-foot-11, 185 lb build with a strong lower half.
Pitching: Side step into a leg lift with a hip coil before driving out in line and accelerating against a strong front side; Arm drops straigh down out of the glove before working up quick through a power 3/4 slot. FB: Has lif through the zone with advanced induced vertical break up to 22". CB: High spin (2453 RPM) with 11-5 shape and advanced movement (19" vertical drop / 12" horizontal movement). CH: Good hand speed with up to 17" arm side fade