CLASS OF 2023
RHP
OF
Ryan
Cavanaugh
Charleston Southern
Harry S. Truman (HS) • PA
6' 0" • 150LBS
R/R • 19yr 10mo
Travel Team: Baseball U Philly
Harry S. Truman (HS) • PA
6' 0" • 150LBS
R/R • 19yr 10mo
Travel Team: Baseball U Philly
Rankings
2023 National
Rankings available to Premium Subscriber
2023 State
Rankings available to Premium Subscriber
Commitment
Best Of Stats
Fastball
89.7
Velocity (max)
6/12/22
86.6 - 88.9
Velo Range
6/12/22
2321
Spin Rate (avg)
9/12/21
Changeup
81.5 - 83.3
Velo Range
6/12/22
1722
Spin Rate (avg)
6/12/22
Curveball
75 - 77
Velo Range
9/12/21
2198
Spin Rate (avg)
6/15/21
Slider
76.3 - 78.4
Velo Range
9/12/21
2325
Spin Rate (avg)
9/12/21
86.3
Exit Velocity (max)
9/12/21
77.1
Exit Velocity (avg)
9/12/21
263
Distance (max)
3/07/21
78
Sweet Spot %
2/24/22
20.8
Hand Speed (max)
2/24/22
70.4
Bat Speed (max)
9/12/21
5.6
Rot. Acc (max)
2/24/22
-
Hard Hit %
7.06
60
9/12/21
-
30-yd
-
10-yd
-
Run speed (max)
-
INF Velo
93
OF Velo
2/24/22
-
C Velo
-
Pop Time
Positional Tools
2022
2021
Outfield Velocity
The athlete's maximum throwing velocity from an outfield position in the given event year. Measured in miles per hour (MPH).
93.0
60 Yard Dash
The athlete's fastest 60-yard dash time in the given event year. Measured in seconds (s)
7.06
Outfield Velocity
The athlete's maximum throwing velocity from an outfield position in the given event year. Measured in miles per hour (MPH).
89.0
Power / Speed Score
A simple calculation that divides the athlete’s Exit Velocity Max by the athlete’s 60 Yard Dash time for the given event year. For example, 98 MPH / 7.00s = 14.00.
12.2
Hitting

2022
2021
Exit Velocity Max
The highest exit velocity of any batted ball in the given event year. Measured in miles per hour (MPH).
85.9
Exit Velocity Avg
Average exit velocity of all batted balls in the given event year. Measured in miles per hour (MPH).
75.3
Distance Max
The highest flight distance of any batted ball in the given event year. Measured in feet (ft).
248
Distance Avg
Average flight distance of all batted balls in the given event year. Measured in feet (ft).
183
Launch Angle Avg
Average launch angle of all batted balls in the given event year. Measured in degrees.
22.6
Hard Hit %
Percentage of batted balls with exit velocities over 95 MPH in the given event year.
Sweet Spot %
Percentage of batted balls in the given event year with a launch angle between 8° and 32°.
Line Drive %
Percentage of batted balls with launch angles between 10 and 25 degrees in the given event year.
Fly Ball %
Percentage of batted balls with launch angles between 25 and 50 degrees in the given event year.
Ground Ball %
Percentage of batted balls with launch angles below 10 degrees in the given event year.
Exit Velocity Max
The highest exit velocity of any batted ball in the given event year. Measured in miles per hour (MPH).
86.3
Exit Velocity Avg
Average exit velocity of all batted balls in the given event year. Measured in miles per hour (MPH).
73.5
Distance Max
The highest flight distance of any batted ball in the given event year. Measured in feet (ft).
263
Distance Avg
Average flight distance of all batted balls in the given event year. Measured in feet (ft).
173
Launch Angle Avg
Average launch angle of all batted balls in the given event year. Measured in degrees.
19.1
Hard Hit %
Percentage of batted balls with exit velocities over 95 MPH in the given event year.
Sweet Spot %
Percentage of batted balls in the given event year with a launch angle between 8° and 32°.
Line Drive %
Percentage of batted balls with launch angles between 10 and 25 degrees in the given event year.
Fly Ball %
Percentage of batted balls with launch angles between 25 and 50 degrees in the given event year.
Ground Ball %
Percentage of batted balls with launch angles below 10 degrees in the given event year.
2022 Baseball U Philly/Pocono Scout Day
Feb 24, 2022
Trackman - Hitting
85.9
Exit Velocity (max)
75.3
Exit Velocity (avg)
183
Distance (avg)
248
Distance (max)
Sweet Spot %
Line Drive %
Fly Ball %
Ground Ball %
2021 Baseball U - Philly Scout Day (Fall)
Sep 12, 2021
Trackman - Hitting
86.3
Exit Velocity (max)
77.1
Exit Velocity (avg)
176
Distance (avg)
261
Distance (max)
Sweet Spot %
Line Drive %
Fly Ball %
Ground Ball %
2021 Baseball U - Philly Scout Day (Preseason)
Mar 7, 2021
Trackman - Hitting
77.3
Exit Velocity (max)
70.3
Exit Velocity (avg)
171
Distance (avg)
263
Distance (max)
Sweet Spot %
Line Drive %
Fly Ball %
Ground Ball %
Hitting

2022
2021
Hand Speed Max
The highest Peak Hand Speed of any swing in the given event year.
20.8
Hand Speed Avg
The average Peak Hand Speed for all swings in the given event year.
19.2
Bat Speed Max
The highest Bat Speed of any swing in the given event year.
66.5
Bat Speed Avg
The average Bat Speed for all swings in the given event year.
64.4
Rotational Acceleration Max
The highest Rotational Acceleration of any swing in the given event year.
Rotational Acceleration Avg
The average Rotational Acceleration for all swings in the given event year.
On-Plane Efficiency Max
The highest On-Plane Efficiency of any swing in the given event year.
On-Plane Efficiency Avg
The average On-Plane Efficiency for all swings in the given event year.
Hand Speed Max
The highest Peak Hand Speed of any swing in the given event year.
20.1
Hand Speed Avg
The average Peak Hand Speed for all swings in the given event year.
19.1
Bat Speed Max
The highest Bat Speed of any swing in the given event year.
70.4
Bat Speed Avg
The average Bat Speed for all swings in the given event year.
62.8
Rotational Acceleration Max
The highest Rotational Acceleration of any swing in the given event year.
Rotational Acceleration Avg
The average Rotational Acceleration for all swings in the given event year.
On-Plane Efficiency Max
The highest On-Plane Efficiency of any swing in the given event year.
On-Plane Efficiency Avg
The average On-Plane Efficiency for all swings in the given event year.
2022 Baseball U Philly/Pocono Scout Day
Feb 24, 2022
Blast - Hitting
20.8
Hand Speed (max)
19.2
Hand Speed (avg)
66.5
Bat Speed (max)
64.4
Bat Speed (avg)
Rot. Acc (max)
Rot. Acc (avg)
On Plane Eff (avg)
MaxOnPlaneEfficiency
2021 Baseball U - Philly Scout Day (Fall)
Sep 12, 2021
Blast - Hitting
20.1
Hand Speed (max)
18.9
Hand Speed (avg)
70.4
Bat Speed (max)
66.2
Bat Speed (avg)
Rot. Acc (max)
Rot. Acc (avg)
On Plane Eff (avg)
MaxOnPlaneEfficiency
2021 Baseball U - Philly Scout Day (Preseason)
Mar 7, 2021
Blast - Hitting
20.0
Hand Speed (max)
19.2
Hand Speed (avg)
63.2
Bat Speed (max)
60.2
Bat Speed (avg)
Rot. Acc (max)
Rot. Acc (avg)
On Plane Eff (avg)
MaxOnPlaneEfficiency
Pitching

2022
2021
Fastball
Velocity Max
The maximum observed fastball velocity in the given event year. Measured in miles per hour (MPH).
89.7
Fastball
Velocity Avg
The average velocity for all pitches of this type in the given event year. Measured in miles per hour (MPH).
87.4
Fastball
Spin Rate Avg
The average rate of spin for all pitches of this type in the given event year. Measured in rotations per minute (RPM).
2191
Fastball
Spin Score Avg
The average Bauer Units value of all fastballs in the given event year. Bauer Units are calculated for each pitch by dividing Spin Rate by Velocity.
25.1
Fastball
Total Movement Avg
The average total non-gravity movement for all pitches of this type in the given event year. Measured in inches (in).
Curveball
Velocity Avg
The average velocity for all pitches of this type in the given event year. Measured in miles per hour (MPH).
73.6
Curveball
Spin Rate Avg
The average rate of spin for all pitches of this type in the given event year. Measured in rotations per minute (RPM).
2196
Curveball
Total Movement Avg
The average total non-gravity movement for all pitches of this type in the given event year. Measured in inches (in).
Changeup
Velocity Avg
The average velocity for all pitches of this type in the given event year. Measured in miles per hour (MPH).
82.2
Changeup
Spin Rate Avg
The average rate of spin for all pitches of this type in the given event year. Measured in rotations per minute (RPM).
1668
Changeup
Total Movement Avg
The average total non-gravity movement for all pitches of this type in the given event year. Measured in inches (in).
Slider
Velocity Avg
The average velocity for all pitches of this type in the given event year. Measured in miles per hour (MPH).
76.9
Slider
Spin Rate Avg
The average rate of spin for all pitches of this type in the given event year. Measured in rotations per minute (RPM).
1888
Slider
Total Movement Avg
The average total non-gravity movement for all pitches of this type in the given event year. Measured in inches (in).
Fastball
Velocity Max
The maximum observed fastball velocity in the given event year. Measured in miles per hour (MPH).
86.6
Fastball
Velocity Avg
The average velocity for all pitches of this type in the given event year. Measured in miles per hour (MPH).
84.0
Fastball
Spin Rate Avg
The average rate of spin for all pitches of this type in the given event year. Measured in rotations per minute (RPM).
2109
Fastball
Spin Score Avg
The average Bauer Units value of all fastballs in the given event year. Bauer Units are calculated for each pitch by dividing Spin Rate by Velocity.
25.1
Fastball
Total Movement Avg
The average total non-gravity movement for all pitches of this type in the given event year. Measured in inches (in).
Curveball
Velocity Avg
The average velocity for all pitches of this type in the given event year. Measured in miles per hour (MPH).
73.6
Curveball
Spin Rate Avg
The average rate of spin for all pitches of this type in the given event year. Measured in rotations per minute (RPM).
2150
Curveball
Total Movement Avg
The average total non-gravity movement for all pitches of this type in the given event year. Measured in inches (in).
Changeup
Velocity Avg
The average velocity for all pitches of this type in the given event year. Measured in miles per hour (MPH).
77.8
Changeup
Spin Rate Avg
The average rate of spin for all pitches of this type in the given event year. Measured in rotations per minute (RPM).
1633
Changeup
Total Movement Avg
The average total non-gravity movement for all pitches of this type in the given event year. Measured in inches (in).
Slider
Velocity Avg
The average velocity for all pitches of this type in the given event year. Measured in miles per hour (MPH).
75.3
Slider
Spin Rate Avg
The average rate of spin for all pitches of this type in the given event year. Measured in rotations per minute (RPM).
2225
Slider
Total Movement Avg
The average total non-gravity movement for all pitches of this type in the given event year. Measured in inches (in).
2022 PA State Games (Session 1)
Jun 12, 2022
Trackman - Fastball
89.7
Velocity (max)
86.6 - 88.9
Velo Range
87.2
Eff Velocity (avg)
2,385
Spin Rate (max)
2,179
Spin Rate (avg)
IVB (max)
IVB (avg)
HM (max)
HM (avg)
Extension (avg)
Release Ht (avg)
Spin Score (max)
Zone %
Trackman - Slider
78.6
Velocity (max)
75.8 - 78.1
Velo Range
76.1
Eff Velocity (avg)
2,221
Spin Rate (max)
1,888
Spin Rate (avg)
IVB (max)
IVB (avg)
HM (max)
HM (avg)
Extension (avg)
Release Ht (avg)
Spin Score (max)
Zone %
Trackman - ChangeUp
83.8
Velocity (max)
81.5 - 83.3
Velo Range
81.6
Eff Velocity (avg)
1,808
Spin Rate (max)
1,722
Spin Rate (avg)
IVB (max)
IVB (avg)
HM (max)
HM (avg)
Extension (avg)
Release Ht (avg)
Spin Score (max)
Zone %
2022 Baseball U Philly/Pocono Scout Day
Feb 24, 2022
Trackman - Fastball
87.6
Velocity (max)
85.5 - 87.4
Velo Range
88.9
Eff Velocity (avg)
2,385
Spin Rate (max)
2,226
Spin Rate (avg)
IVB (max)
IVB (avg)
HM (max)
HM (avg)
Extension (avg)
Release Ht (avg)
Spin Score (max)
Zone %
Trackman - Curveball
74.8
Velocity (max)
72.7 - 74.4
Velo Range
74.5
Eff Velocity (avg)
2,262
Spin Rate (max)
2,196
Spin Rate (avg)
IVB (max)
IVB (avg)
HM (max)
HM (avg)
Extension (avg)
Release Ht (avg)
Spin Score (max)
Zone %
Trackman - ChangeUp
83.2
Velocity (max)
80.5 - 83.1
Velo Range
84.0
Eff Velocity (avg)
1,598
Spin Rate (max)
1,550
Spin Rate (avg)
IVB (max)
IVB (avg)
HM (max)
HM (avg)
Extension (avg)
Release Ht (avg)
Spin Score (max)
Zone %
2021 Baseball U - Philly Scout Day (Fall)
Sep 12, 2021
Trackman - Fastball
86.5
Velocity (max)
84.9 - 86.5
Velo Range
86.5
Eff Velocity (avg)
2,376
Spin Rate (max)
2,321
Spin Rate (avg)
IVB (max)
IVB (avg)
HM (max)
HM (avg)
Extension (avg)
Release Ht (avg)
Spin Score (max)
Zone %
Trackman - Curveball
76.7
Velocity (max)
75.0 - 76.7
Velo Range
75.7
Eff Velocity (avg)
2,216
Spin Rate (max)
2,190
Spin Rate (avg)
IVB (max)
IVB (avg)
HM (max)
HM (avg)
Extension (avg)
Release Ht (avg)
Spin Score (max)
Trackman - Slider
78.6
Velocity (max)
76.3 - 78.4
Velo Range
76.5
Eff Velocity (avg)
2,343
Spin Rate (max)
2,325
Spin Rate (avg)
Extension (avg)
Release Ht (avg)
Spin Score (max)
Trackman - ChangeUp
77.7
Velocity (max)
76.6 - 77.7
Velo Range
77.3
Eff Velocity (avg)
1,740
Spin Rate (max)
1,707
Spin Rate (avg)
IVB (max)
IVB (avg)
HM (max)
HM (avg)
Extension (avg)
Release Ht (avg)
Spin Score (max)
Zone %
2021 PA State Games / 2023-2024 Grads
Jun 15, 2021
Trackman - Fastball
86.6
Velocity (max)
82.7 - 84.9
Velo Range
81.4
Eff Velocity (avg)
2,258
Spin Rate (max)
2,097
Spin Rate (avg)
IVB (max)
IVB (avg)
HM (max)
HM (avg)
Extension (avg)
Release Ht (avg)
Spin Score (max)
Zone %
Trackman - Curveball
76.0
Velocity (max)
72.7 - 75.0
Velo Range
71.5
Eff Velocity (avg)
2,337
Spin Rate (max)
2,198
Spin Rate (avg)
IVB (max)
IVB (avg)
HM (max)
HM (avg)
Extension (avg)
Release Ht (avg)
Spin Score (max)
Zone %
Trackman - Slider
76.6
Velocity (max)
74.6 - 76.5
Velo Range
74.1
Eff Velocity (avg)
2,222
Spin Rate (max)
2,181
Spin Rate (avg)
IVB (max)
IVB (avg)
HM (max)
HM (avg)
Extension (avg)
Release Ht (avg)
Spin Score (max)
Zone %
2021 Baseball U - Philly Scout Day (Preseason)
Mar 7, 2021
Trackman - Fastball
85.8
Velocity (max)
82.0 - 85.8
Velo Range
84.0
Eff Velocity (avg)
2,146
Spin Rate (max)
2,056
Spin Rate (avg)
IVB (max)
IVB (avg)
HM (max)
HM (avg)
Extension (avg)
Release Ht (avg)
Spin Score (max)
Zone %
Trackman - Curveball
72.9
Velocity (max)
70.8 - 72.6
Velo Range
70.8
Eff Velocity (avg)
2,075
Spin Rate (max)
2,029
Spin Rate (avg)
IVB (max)
IVB (avg)
HM (max)
HM (avg)
Extension (avg)
Release Ht (avg)
Spin Score (max)
Trackman - Slider
69.5
Velocity (max)
2,056
Spin Rate (max)
2,056
Spin Rate (avg)
IVB (max)
IVB (avg)
HM (max)
HM (avg)
Release Ht (avg)
Spin Score (max)
Zone %
Trackman - ChangeUp
78.9
Velocity (max)
78.1 - 78.9
Velo Range
78.3
Eff Velocity (avg)
1,646
Spin Rate (max)
1,522
Spin Rate (avg)
IVB (max)
IVB (avg)
HM (max)
HM (avg)
Extension (avg)
Release Ht (avg)
Spin Score (max)
Pitch Scores
Pitching Velos
2021
Fastball
Velocity Max
The maximum observed fastball velocity in the given event year. Measured in miles per hour (MPH).
87.0
Fastball
Velocity Avg
The average velocity for all pitches of this type in the given event year. Measured in miles per hour (MPH)
83.9
Curveball
Velocity Avg
The average velocity for all pitches of this type in the given event year. Measured in miles per hour (MPH)
74.2
Changeup
Velocity Avg
The average velocity for all pitches of this type in the given event year. Measured in miles per hour (MPH)
77.8
Slider
Velocity Avg
The average velocity for all pitches of this type in the given event year. Measured in miles per hour (MPH)
74.1
Game Performance

Visual Edge

Pitch Ai

Notes
News
Comments
Draft Reports
Contact
Premium Content Area
To unlock contact information, you need to purchase a ScoutPLUS subscription.
Purchase Subscription OR
Login


 Sign in to view rankings
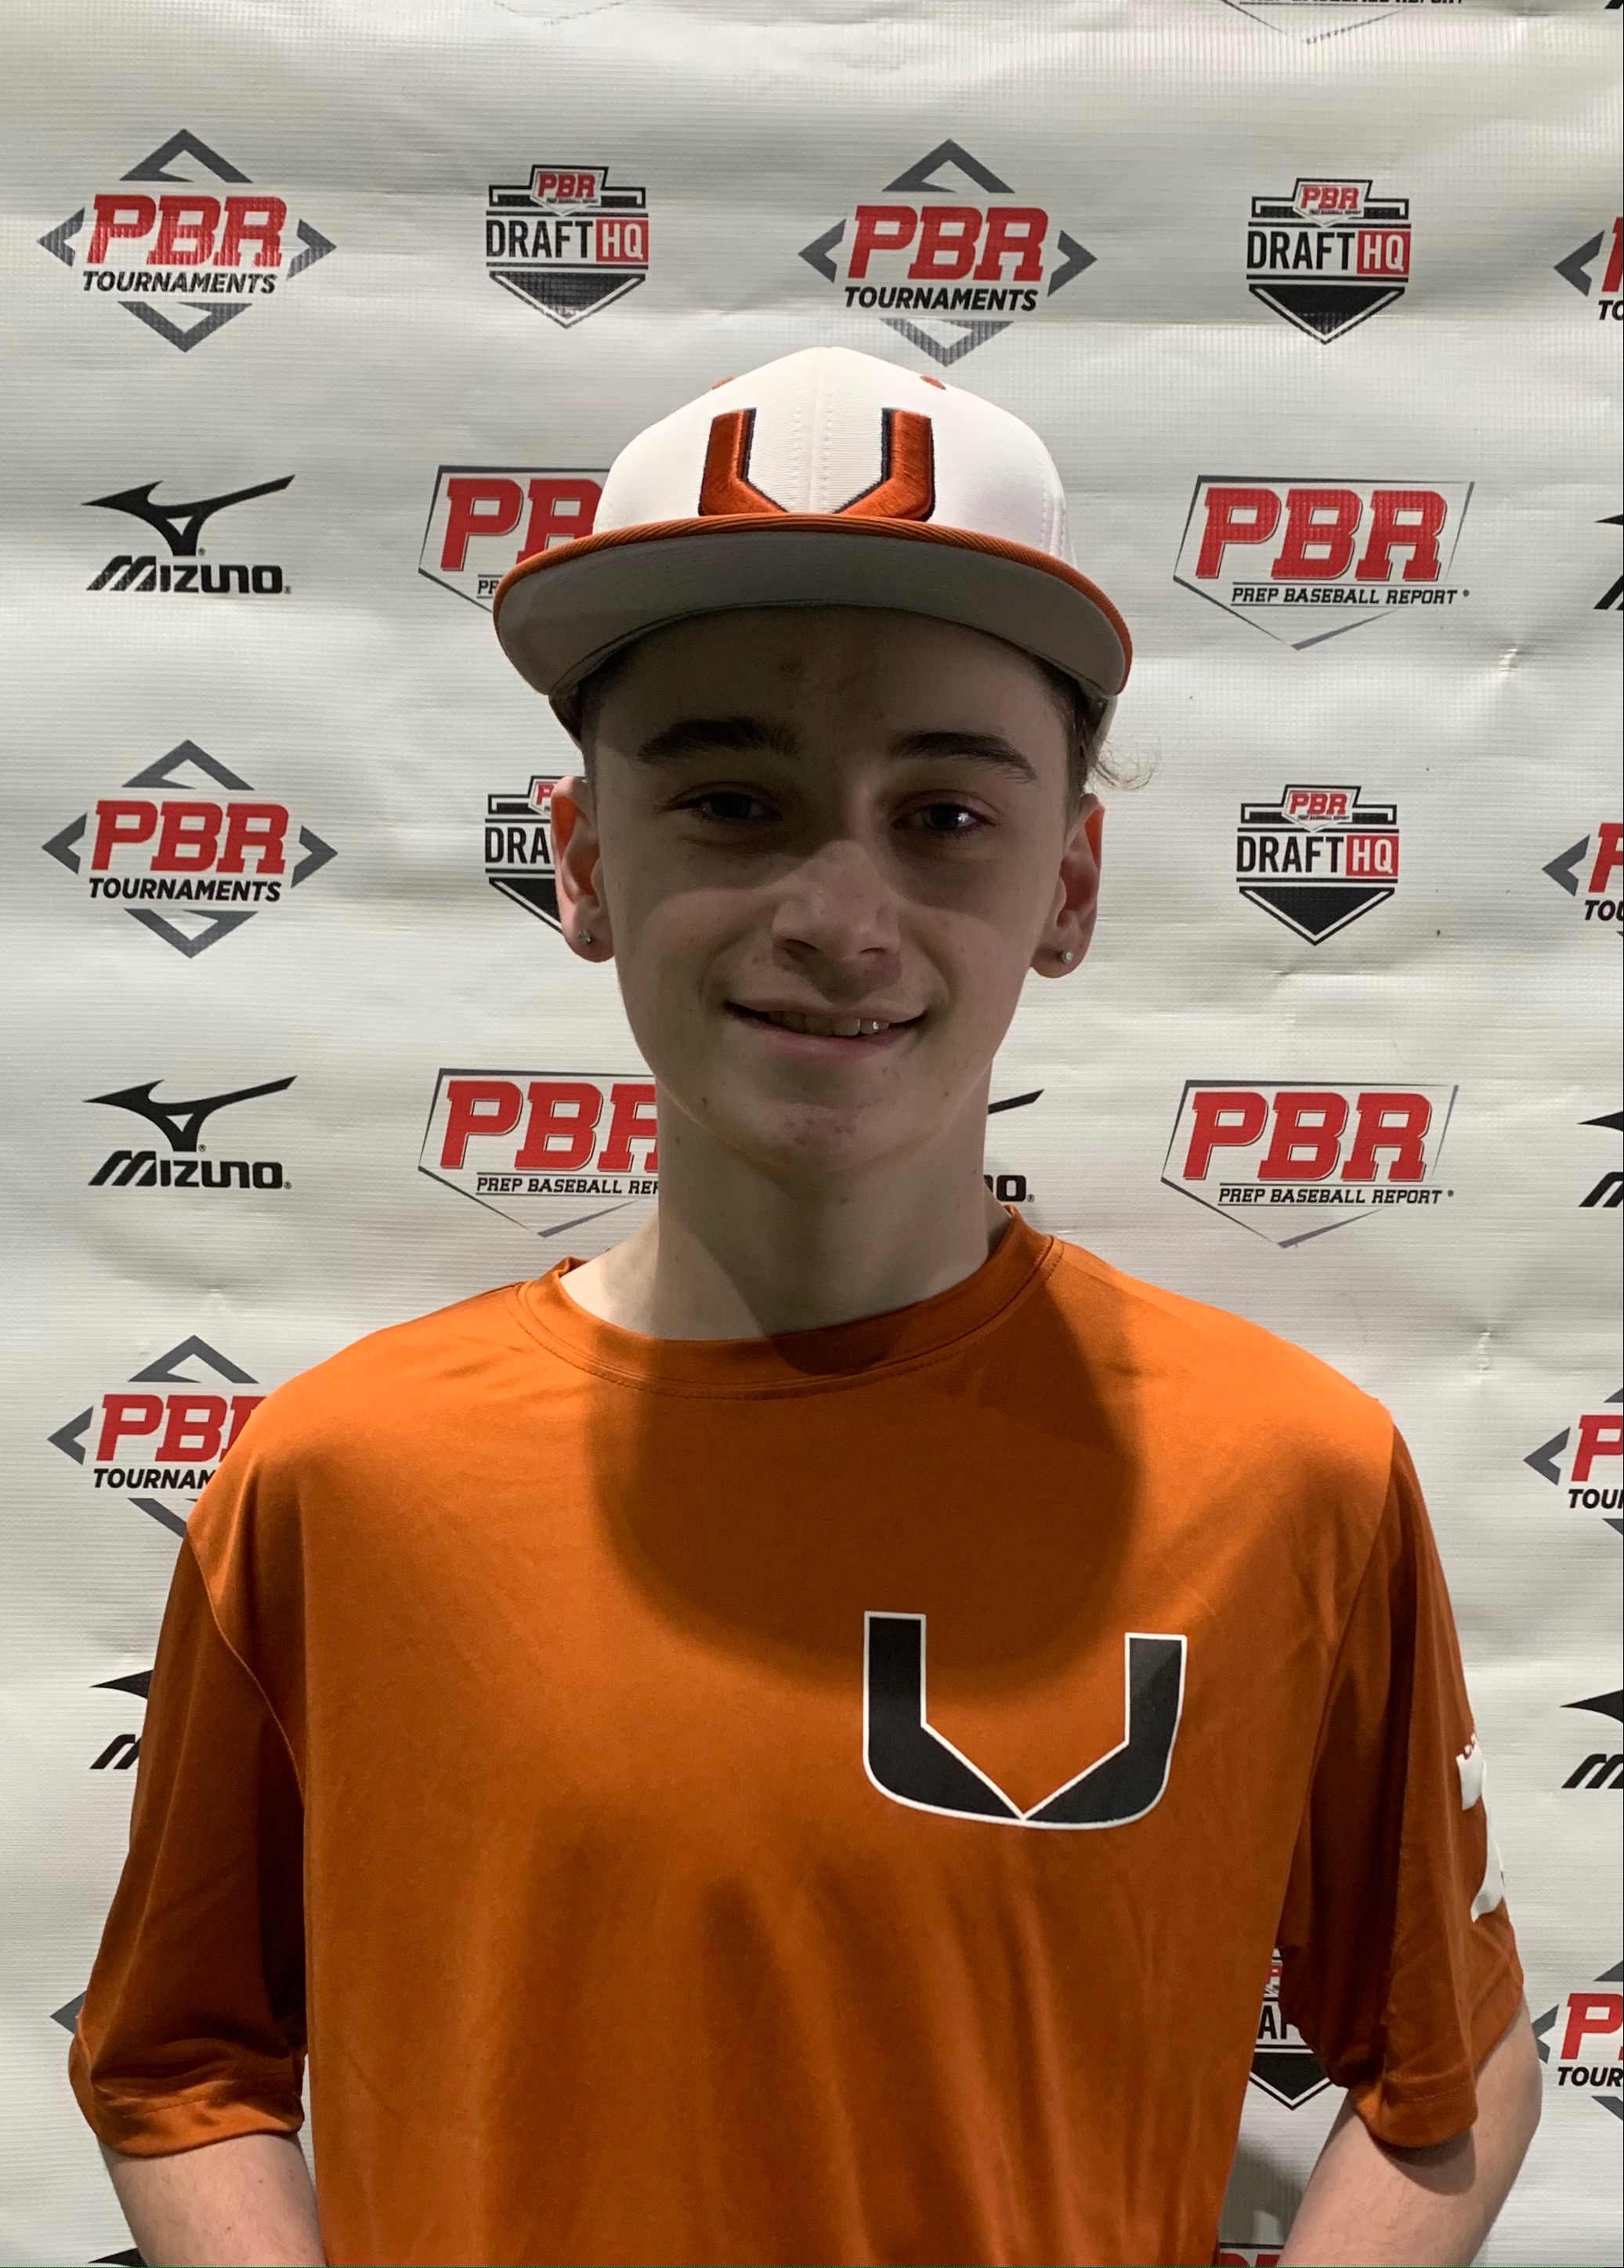
Physical: Wiry athletic, high-waisted 6-foot, 150lb frame with mound presence.
Pitching: RHP - Struck out a plethora of hitters during his look at the PA State Games. The twitchy thrower gathered with slower pace to the stack, racing out of it with advanced arm-speed on lighting quick upper-80’s FB, that touched a 90 mph once (2350rpms). Went to sharper 76-78 mph SL and fading 80-82 mph CH, getting whiffs all over the zone to both LHH and RHH. One of, if not the most dominant performance of the event on the mound; attacked.
Physical: Ultra-lean, high-waisted 5-foot-11, 140lb frame with efficient movement patterns and life in the arm on the bump.
Pitching: RHP - Started off the far left side of the rubber with a short/quick side rocker into a controlled, gradual stack at waist height; held pace into footstrike with high intent/separation, allowing for a whippy, high ¾ slot at release. Lots of violence down the mound, but generated solid carry (T20 inches IVB) on an 83-86, T87 mph FB that found the zone at a 57% clip. Countered with a hard-thrown 73-75 mph CB with short two-plane shape at a 67% zone rate and later added a better 75-77 mph SL as the strikeout offering, missing barrels with bite off the plate. High ceiling and hard to hit when in the strike zone with multiple offerings.