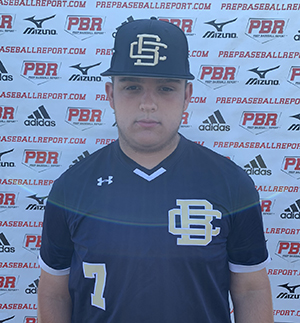
CLASS OF 2023
1B
LHP
Easton
Wasinger
St. Louis
Blue Valley Northwest (HS) • KS
6' 2" • 230LBS
L/L • 20yr 3mo
Travel Team: Royals Scout Team - 17U
Blue Valley Northwest (HS) • KS
6' 2" • 230LBS
L/L • 20yr 3mo
Travel Team: Royals Scout Team - 17U
Rankings
2023 National
Rankings available to Premium Subscriber
2023 State
Rankings available to Premium Subscriber
Commitment
Best Of Stats
23.4
Hand Speed (max)
7/28/21
78.6
Bat Speed (max)
7/28/21
18.8
Rot. Acc (max)
2/14/21
40
Hard Hit %
7/28/21
97.8
Exit Velocity (max)
7/28/21
86.9
Exit Velocity (avg)
2/14/21
345
Distance (max)
7/28/21
100
Sweet Spot %
2/14/21
7.84
60
7/28/21
-
30-yd
-
10-yd
-
Run speed (max)
74
INF Velo
2/14/21
-
OF Velo
-
C Velo
-
Pop Time
Fastball
79
Velocity (max)
6/24/21
76 - 78
Velo Range
2/14/21
1618
Spin Rate (avg)
2/14/21
Changeup
70 - 70
Velo Range
2/14/21
1435
Spin Rate (avg)
2/14/21
Curveball
63 - 69
Velo Range
6/24/21
1370
Spin Rate (avg)
2/14/21
Slider
70 - 70.3
Velo Range
2/14/21
1463
Spin Rate (avg)
2/14/21
Positional Tools
2021
2020
60 Yard Dash
The athlete's fastest 60-yard dash time in the given event year. Measured in seconds (s)
7.84
Home to First
The athlete's fastest home-to-first time in the given event year. Measured from bat-on-ball to foot-on-bag, in seconds (s).
4.62
Infield Velocity
The athlete's maximum throwing velocity from an infield position in the given event year. Measured in miles per hour (MPH).
74.0
Power / Speed Score
A simple calculation that divides the athlete’s Exit Velocity Max by the athlete’s 60 Yard Dash time for the given event year. For example, 98 MPH / 7.00s = 14.00.
11.7
60 Yard Dash
The athlete's fastest 60-yard dash time in the given event year. Measured in seconds (s)
8.55
Infield Velocity
The athlete's maximum throwing velocity from an infield position in the given event year. Measured in miles per hour (MPH).
63.0
Power / Speed Score
A simple calculation that divides the athlete’s Exit Velocity Max by the athlete’s 60 Yard Dash time for the given event year. For example, 98 MPH / 7.00s = 14.00.
10.2
Hitting

2021
Exit Velocity Max
The highest exit velocity of any batted ball in the given event year. Measured in miles per hour (MPH).
91.8
Exit Velocity Avg
Average exit velocity of all batted balls in the given event year. Measured in miles per hour (MPH).
86.9
Distance Max
The highest flight distance of any batted ball in the given event year. Measured in feet (ft).
298
Distance Avg
Average flight distance of all batted balls in the given event year. Measured in feet (ft).
239
Launch Angle Avg
Average launch angle of all batted balls in the given event year. Measured in degrees.
17.5
Hard Hit %
Percentage of batted balls with exit velocities over 95 MPH in the given event year.
Sweet Spot %
Percentage of batted balls in the given event year with a launch angle between 8° and 32°.
Line Drive %
Percentage of batted balls with launch angles between 10 and 25 degrees in the given event year.
Fly Ball %
Percentage of batted balls with launch angles between 25 and 50 degrees in the given event year.
Ground Ball %
Percentage of batted balls with launch angles below 10 degrees in the given event year.
CO/UT/OK/Select Workout Pod
Jul 28, 2021
Trackman - Hitting
97.8
Exit Velocity (max)
67.4
Exit Velocity (avg)
121
Distance (avg)
345
Distance (max)
Hard Hit %
Sweet Spot %
Line Drive %
Ground Ball %
2021 Future Games
Jul 28, 2021
Trackman - Hitting
97.8
Exit Velocity (max)
67.4
Exit Velocity (avg)
121
Distance (avg)
345
Distance (max)
Hard Hit %
Sweet Spot %
Line Drive %
Ground Ball %
MOKAN Preseason All-State (Invite-Only)
Feb 14, 2021
Trackman - Hitting
91.8
Exit Velocity (max)
86.9
Exit Velocity (avg)
239
Distance (avg)
298
Distance (max)
Hard Hit %
Sweet Spot %
Line Drive %
Fly Ball %
Hitting

2021
Hand Speed Max
The highest Peak Hand Speed of any swing in the given event year.
23.4
Hand Speed Avg
The average Peak Hand Speed for all swings in the given event year.
21.5
Bat Speed Max
The highest Bat Speed of any swing in the given event year.
78.6
Bat Speed Avg
The average Bat Speed for all swings in the given event year.
71.8
Rotational Acceleration Max
The highest Rotational Acceleration of any swing in the given event year.
Rotational Acceleration Avg
The average Rotational Acceleration for all swings in the given event year.
On-Plane Efficiency Max
The highest On-Plane Efficiency of any swing in the given event year.
On-Plane Efficiency Avg
The average On-Plane Efficiency for all swings in the given event year.
2021 Future Games
Jul 28, 2021
Blast - Hitting
23.4
Hand Speed (max)
22.3
Hand Speed (avg)
78.6
Bat Speed (max)
74.3
Bat Speed (avg)
Rot. Acc (max)
Rot. Acc (avg)
On Plane Eff (avg)
MaxOnPlaneEfficiency
CO/UT/OK/Select Workout Pod
Jul 28, 2021
Blast - Hitting
23.4
Hand Speed (max)
22.3
Hand Speed (avg)
78.6
Bat Speed (max)
74.3
Bat Speed (avg)
Rot. Acc (max)
Rot. Acc (avg)
On Plane Eff (avg)
MOKAN Preseason All-State (Invite-Only)
Feb 14, 2021
Blast - Hitting
21.7
Hand Speed (max)
20.9
Hand Speed (avg)
74.4
Bat Speed (max)
70.3
Bat Speed (avg)
Rot. Acc (max)
Rot. Acc (avg)
On Plane Eff (avg)
MaxOnPlaneEfficiency
Pitching

2021
Fastball
Velocity Max
The maximum observed fastball velocity in the given event year. Measured in miles per hour (MPH).
78.4
Fastball
Velocity Avg
The average velocity for all pitches of this type in the given event year. Measured in miles per hour (MPH).
76.9
Fastball
Spin Rate Avg
The average rate of spin for all pitches of this type in the given event year. Measured in rotations per minute (RPM).
1618
Fastball
Spin Score Avg
The average Bauer Units value of all fastballs in the given event year. Bauer Units are calculated for each pitch by dividing Spin Rate by Velocity.
21.0
Fastball
Total Movement Avg
The average total non-gravity movement for all pitches of this type in the given event year. Measured in inches (in).
Curveball
Velocity Avg
The average velocity for all pitches of this type in the given event year. Measured in miles per hour (MPH).
63.3
Curveball
Spin Rate Avg
The average rate of spin for all pitches of this type in the given event year. Measured in rotations per minute (RPM).
1370
Curveball
Total Movement Avg
The average total non-gravity movement for all pitches of this type in the given event year. Measured in inches (in).
Changeup
Velocity Avg
The average velocity for all pitches of this type in the given event year. Measured in miles per hour (MPH).
69.6
Changeup
Spin Rate Avg
The average rate of spin for all pitches of this type in the given event year. Measured in rotations per minute (RPM).
1435
Changeup
Total Movement Avg
The average total non-gravity movement for all pitches of this type in the given event year. Measured in inches (in).
Slider
Velocity Avg
The average velocity for all pitches of this type in the given event year. Measured in miles per hour (MPH).
70.2
Slider
Spin Rate Avg
The average rate of spin for all pitches of this type in the given event year. Measured in rotations per minute (RPM).
1463
Slider
Total Movement Avg
The average total non-gravity movement for all pitches of this type in the given event year. Measured in inches (in).
Sinker
Velocity Avg
The average velocity for all pitches of this type in the given event year. Measured in miles per hour (MPH).
76.6
Sinker
Spin Rate Avg
The average rate of spin for all pitches of this type in the given event year. Measured in rotations per minute (RPM).
1694
Sinker
Total Movement Avg
The average total non-gravity movement for all pitches of this type in the given event year. Measured in inches (in).
MOKAN Preseason All-State (Invite-Only)
Feb 14, 2021
Trackman - Fastball
78.4
Velocity (max)
76.0 - 77.8
Velo Range
1,873
Spin Rate (max)
1,618
Spin Rate (avg)
IVB (max)
IVB (avg)
HM (max)
HM (avg)
Release Ht (avg)
Spin Score (max)
Zone %
Trackman - Curveball
63.5
Velocity (max)
63.0 - 63.5
Velo Range
1,465
Spin Rate (max)
1,370
Spin Rate (avg)
IVB (max)
IVB (avg)
HM (max)
HM (avg)
Release Ht (avg)
Spin Score (max)
Zone %
Trackman - Slider
70.3
Velocity (max)
70.0 - 70.3
Velo Range
1,468
Spin Rate (max)
1,463
Spin Rate (avg)
IVB (max)
IVB (avg)
HM (max)
HM (avg)
Release Ht (avg)
Spin Score (max)
Trackman - ChangeUp
69.6
Velocity (max)
1,435
Spin Rate (max)
1,435
Spin Rate (avg)
IVB (max)
IVB (avg)
HM (max)
HM (avg)
Release Ht (avg)
Spin Score (max)
Zone %
Trackman - Sinker
77.8
Velocity (max)
75.9 - 77.7
Velo Range
85.8
Eff Velocity (avg)
1,781
Spin Rate (max)
1,694
Spin Rate (avg)
IVB (max)
IVB (avg)
HM (max)
HM (avg)
Extension (avg)
Release Ht (avg)
Spin Score (max)
Zone %
Pitch Scores
Pitching Velos
2021
2020
Fastball
Velocity Max
The maximum observed fastball velocity in the given event year. Measured in miles per hour (MPH).
79.0
Fastball
Velocity Avg
The average velocity for all pitches of this type in the given event year. Measured in miles per hour (MPH)
76.5
Curveball
Velocity Avg
The average velocity for all pitches of this type in the given event year. Measured in miles per hour (MPH)
64.8
Changeup
Velocity Avg
The average velocity for all pitches of this type in the given event year. Measured in miles per hour (MPH)
70.0
Slider
Velocity Avg
The average velocity for all pitches of this type in the given event year. Measured in miles per hour (MPH)
70.0
Fastball
Velocity Max
The maximum observed fastball velocity in the given event year. Measured in miles per hour (MPH).
74.0
Fastball
Velocity Avg
The average velocity for all pitches of this type in the given event year. Measured in miles per hour (MPH)
71.0
Curveball
Velocity Avg
The average velocity for all pitches of this type in the given event year. Measured in miles per hour (MPH)
57.0
Changeup
Velocity Avg
The average velocity for all pitches of this type in the given event year. Measured in miles per hour (MPH)
61.5
Game Performance

Visual Edge

2021
Edge Score
The highest Edge Score within the given year. Edge Score is a comprehensive score that takes the core-six visual skills into account, providing an assessment of an athlete’s overall visual ability.
72.16
Pitch Ai

Notes
News
- KS Spring Scout Blog - Apr 22, 2023
- KSHSAA Spring Preview: Blue Valley Northwest - Jan 21, 2023
- Creekside Summer Championships (6/16-6/19): Scout Blog - Jun 18, 2022
- 2023 Kansas Uncommitted Spotlights: Corner Infielders - Sep 30, 2021
- August 2021 Most Viewed Kansas Profiles - Sep 10, 2021
- KS Most Viewed Profiles: April - May 11, 2021
- KS Rankings Update: 2023s - Apr 20, 2021
- Kansas High School Spotlight: Blue Valley Northwest High School - Apr 7, 2021
- KS Most Viewed Profiles: March - Apr 5, 2021
- MOKAN Preseason All-State Analysis: Corner INFs - Mar 16, 2021
- KS Most Viewed Profiles: February - Mar 4, 2021
Comments
Draft Reports
Contact
Premium Content Area
To unlock contact information, you need to purchase a ScoutPLUS subscription.
Purchase Subscription OR
Login


 Sign in to view rankings
Positional Profile: 1B/LHP
Body: 6-foot-2, 230-pound stocky and mature frame.
Hit: LHH. At the plate starts with a crouched and very narrow stance. Uses a two tap stride and drifts forward into front leg. Hands set a shoulder height with relaxed back elbow. Shows quick hands and good bat speed. Level bat path. Has some strength at contact. Good balance and body control.
Power: 89 mph exit velocity from the tee.
Arm: LH. INF-74 mph. Over the top arm slot with short arm action.
Defense: In the infield shows soft hands and feel for glove action. Uses short steps when approaching the ball. Exchanges are clean and range is developing.
Run: 4.62 runner from home to first.
Delivery: On the mound uses a rocker style up tempo delivery with consistent rhythm. Short and quick balance point. Sets hands low and exchanges near the belt. High glove side with shoulder tilt. Short strides directionally towards the plate and finishes with good balance.
Arm Action: High ¾ arm slot with short arm action.
FB: 76-78 mph, sinking action with lower spin rate.
CB: 63-64 mph, short 1/7 shape with early break.
SL: 70 mph, short cutting action.
CH: 70 mph, arm side fade with good command.