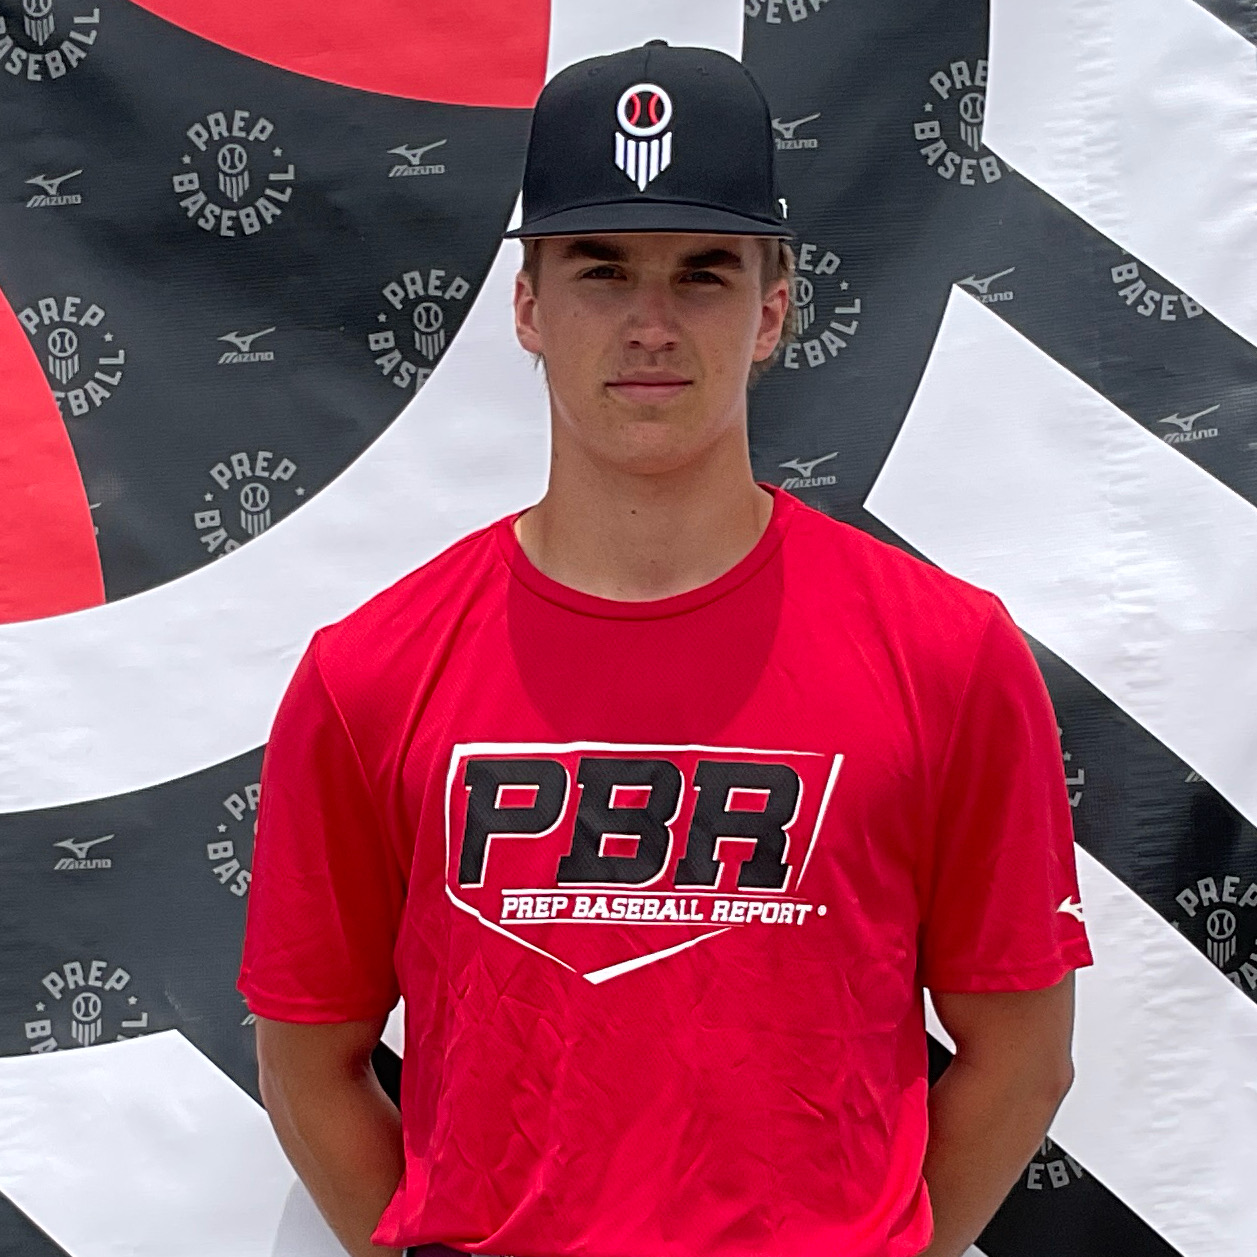
CLASS OF 2025
RHP
Jack
Butterworth
Minnetonka (HS) • MN
6' 6" • 209LBS
R/R • 17yr 7mo
Travel Team: MASH Black National
6' 6" • 209LBS
R/R • 17yr 7mo
Travel Team: MASH Black National
Rankings
2025 National
Rankings available to Premium Subscriber
2025 State
Rankings available to Premium Subscriber
Commitment
Best Of Stats
Fastball
92
Velocity (max)
7/25/24
90 - 91
Velo Range
7/25/24
2184
Spin Rate (avg)
7/24/24
Changeup
81.6 - 82
Velo Range
7/24/24
1959
Spin Rate (avg)
7/24/24
Curveball
65 - 69
Velo Range
3/18/23
1816
Spin Rate (avg)
3/18/23
Slider
70.5 - 78.6
Velo Range
7/13/22
2066
Spin Rate (avg)
7/24/24
7.49
60
6/27/23
4.09
30-yd
6/27/23
1.69
10-yd
6/27/23
18
Run speed (max)
6/27/23
Positional Tools
Hitting

Hitting

Pitching

2024
2023
2022
Fastball
Velocity Max
The maximum observed fastball velocity in the given event year. Measured in miles per hour (MPH).
91.6
Fastball
Velocity Avg
The average velocity for all pitches of this type in the given event year. Measured in miles per hour (MPH).
87.9
Fastball
Spin Rate Avg
The average rate of spin for all pitches of this type in the given event year. Measured in rotations per minute (RPM).
2134
Fastball
Spin Score Avg
The average Bauer Units value of all fastballs in the given event year. Bauer Units are calculated for each pitch by dividing Spin Rate by Velocity.
24.3
Fastball
Total Movement Avg
The average total non-gravity movement for all pitches of this type in the given event year. Measured in inches (in).
Changeup
Velocity Avg
The average velocity for all pitches of this type in the given event year. Measured in miles per hour (MPH).
79.2
Changeup
Spin Rate Avg
The average rate of spin for all pitches of this type in the given event year. Measured in rotations per minute (RPM).
1920
Changeup
Total Movement Avg
The average total non-gravity movement for all pitches of this type in the given event year. Measured in inches (in).
Slider
Velocity Avg
The average velocity for all pitches of this type in the given event year. Measured in miles per hour (MPH).
75.0
Slider
Spin Rate Avg
The average rate of spin for all pitches of this type in the given event year. Measured in rotations per minute (RPM).
2027
Slider
Total Movement Avg
The average total non-gravity movement for all pitches of this type in the given event year. Measured in inches (in).
Fastball
Velocity Max
The maximum observed fastball velocity in the given event year. Measured in miles per hour (MPH).
86.2
Fastball
Velocity Avg
The average velocity for all pitches of this type in the given event year. Measured in miles per hour (MPH).
84.5
Fastball
Spin Rate Avg
The average rate of spin for all pitches of this type in the given event year. Measured in rotations per minute (RPM).
2127
Fastball
Spin Score Avg
The average Bauer Units value of all fastballs in the given event year. Bauer Units are calculated for each pitch by dividing Spin Rate by Velocity.
25.2
Fastball
Total Movement Avg
The average total non-gravity movement for all pitches of this type in the given event year. Measured in inches (in).
Curveball
Velocity Avg
The average velocity for all pitches of this type in the given event year. Measured in miles per hour (MPH).
67.1
Curveball
Spin Rate Avg
The average rate of spin for all pitches of this type in the given event year. Measured in rotations per minute (RPM).
1816
Curveball
Total Movement Avg
The average total non-gravity movement for all pitches of this type in the given event year. Measured in inches (in).
Changeup
Velocity Avg
The average velocity for all pitches of this type in the given event year. Measured in miles per hour (MPH).
76.3
Changeup
Spin Rate Avg
The average rate of spin for all pitches of this type in the given event year. Measured in rotations per minute (RPM).
1698
Changeup
Total Movement Avg
The average total non-gravity movement for all pitches of this type in the given event year. Measured in inches (in).
Slider
Velocity Avg
The average velocity for all pitches of this type in the given event year. Measured in miles per hour (MPH).
72.4
Slider
Spin Rate Avg
The average rate of spin for all pitches of this type in the given event year. Measured in rotations per minute (RPM).
1840
Slider
Total Movement Avg
The average total non-gravity movement for all pitches of this type in the given event year. Measured in inches (in).
Fastball
Velocity Max
The maximum observed fastball velocity in the given event year. Measured in miles per hour (MPH).
79.2
Fastball
Velocity Avg
The average velocity for all pitches of this type in the given event year. Measured in miles per hour (MPH).
73.5
Fastball
Spin Rate Avg
The average rate of spin for all pitches of this type in the given event year. Measured in rotations per minute (RPM).
1450
Fastball
Spin Score Avg
The average Bauer Units value of all fastballs in the given event year. Bauer Units are calculated for each pitch by dividing Spin Rate by Velocity.
19.2
Fastball
Total Movement Avg
The average total non-gravity movement for all pitches of this type in the given event year. Measured in inches (in).
Slider
Velocity Avg
The average velocity for all pitches of this type in the given event year. Measured in miles per hour (MPH).
74.1
Slider
Spin Rate Avg
The average rate of spin for all pitches of this type in the given event year. Measured in rotations per minute (RPM).
1999
Slider
Total Movement Avg
The average total non-gravity movement for all pitches of this type in the given event year. Measured in inches (in).
Splitter
Velocity Avg
The average velocity for all pitches of this type in the given event year. Measured in miles per hour (MPH).
68.1
Splitter
Spin Rate Avg
The average rate of spin for all pitches of this type in the given event year. Measured in rotations per minute (RPM).
1302
Splitter
Total Movement Avg
The average total non-gravity movement for all pitches of this type in the given event year. Measured in inches (in).
Senior Future Games (Class of 2025)
Jul 24, 2024
Trackman - Fastball
91.6
Velocity (max)
87.0 - 90.4
Velo Range
88.0
Eff Velocity (avg)
2,359
Spin Rate (max)
2,184
Spin Rate (avg)
IVB (max)
IVB (avg)
HM (max)
HM (avg)
Extension (avg)
Release Ht (avg)
Spin Score (max)
Zone %
Trackman - Slider
78.0
Velocity (max)
74.0 - 77.4
Velo Range
74.2
Eff Velocity (avg)
2,214
Spin Rate (max)
2,066
Spin Rate (avg)
IVB (max)
IVB (avg)
HM (max)
HM (avg)
Extension (avg)
Release Ht (avg)
Spin Score (max)
Zone %
Trackman - ChangeUp
82.0
Velocity (max)
81.6 - 82.0
Velo Range
81.3
Eff Velocity (avg)
2,015
Spin Rate (max)
1,959
Spin Rate (avg)
IVB (max)
IVB (avg)
HM (max)
HM (avg)
Extension (avg)
Release Ht (avg)
Spin Score (max)
Prep Baseball MN State Games (2025 Grads)
Jun 17, 2024
Trackman - Fastball
88.6
Velocity (max)
84.2 - 88.6
Velo Range
86.0
Eff Velocity (avg)
2,184
Spin Rate (max)
2,064
Spin Rate (avg)
IVB (max)
IVB (avg)
HM (max)
HM (avg)
Extension (avg)
Release Ht (avg)
Spin Score (max)
Zone %
Spin Efficiency % (avg)
Trackman - Slider
75.8
Velocity (max)
73.5 - 75.3
Velo Range
72.7
Eff Velocity (avg)
2,105
Spin Rate (max)
1,995
Spin Rate (avg)
IVB (max)
IVB (avg)
HM (max)
HM (avg)
Extension (avg)
Release Ht (avg)
Spin Score (max)
Zone %
Spin Efficiency % (avg)
Trackman - ChangeUp
79.6
Velocity (max)
76.9 - 79.1
Velo Range
77.4
Eff Velocity (avg)
1,965
Spin Rate (max)
1,900
Spin Rate (avg)
IVB (max)
IVB (avg)
HM (max)
HM (avg)
Extension (avg)
Release Ht (avg)
Spin Score (max)
Zone %
Spin Efficiency % (avg)
PBR MN Underclass Prospect Games (2025 Grads)
Jun 27, 2023
Trackman - Fastball
86.2
Velocity (max)
82.9 - 85.3
Velo Range
84.0
Eff Velocity (avg)
2,225
Spin Rate (max)
2,125
Spin Rate (avg)
IVB (max)
IVB (avg)
HM (max)
HM (avg)
Extension (avg)
Release Ht (avg)
Spin Score (max)
Zone %
Spin Efficiency % (avg)
Trackman - Slider
73.2
Velocity (max)
71.9 - 73.0
Velo Range
70.2
Eff Velocity (avg)
1,917
Spin Rate (max)
1,840
Spin Rate (avg)
IVB (max)
IVB (avg)
HM (max)
HM (avg)
Extension (avg)
Release Ht (avg)
Spin Score (max)
Zone %
Spin Efficiency % (avg)
Trackman - ChangeUp
78.7
Velocity (max)
76.1 - 78.0
Velo Range
76.4
Eff Velocity (avg)
1,918
Spin Rate (max)
1,717
Spin Rate (avg)
IVB (max)
IVB (avg)
HM (max)
HM (avg)
Extension (avg)
Release Ht (avg)
Spin Score (max)
Zone %
Spin Efficiency % (avg)
PBR MN Preseason Underclass (2025 Grads)
Mar 18, 2023
Trackman - Fastball
86.1
Velocity (max)
85.2 - 86.0
Velo Range
86.7
Eff Velocity (avg)
2,194
Spin Rate (max)
2,135
Spin Rate (avg)
IVB (max)
IVB (avg)
HM (max)
HM (avg)
Extension (avg)
Release Ht (avg)
Spin Score (max)
Zone %
Spin Efficiency % (avg)
Trackman - Curveball
69.7
Velocity (max)
65.3 - 69.0
Velo Range
67.3
Eff Velocity (avg)
1,858
Spin Rate (max)
1,816
Spin Rate (avg)
IVB (max)
IVB (avg)
HM (max)
HM (avg)
Extension (avg)
Release Ht (avg)
Spin Score (max)
Zone %
Trackman - ChangeUp
76.4
Velocity (max)
73.4 - 76.4
Velo Range
75.6
Eff Velocity (avg)
1,760
Spin Rate (max)
1,667
Spin Rate (avg)
IVB (max)
IVB (avg)
HM (max)
HM (avg)
Extension (avg)
Release Ht (avg)
Spin Score (max)
Zone %
Spin Efficiency % (avg)
PBR MN Summer ID- Minnetonka
Jul 13, 2022
Trackman - Fastball
79.2
Velocity (max)
66.4 - 79.2
Velo Range
72.8
Eff Velocity (avg)
1,949
Spin Rate (max)
1,450
Spin Rate (avg)
IVB (max)
IVB (avg)
HM (max)
HM (avg)
Extension (avg)
Release Ht (avg)
Spin Score (max)
Zone %
Trackman - Slider
79.1
Velocity (max)
70.5 - 78.6
Velo Range
73.7
Eff Velocity (avg)
2,102
Spin Rate (max)
1,999
Spin Rate (avg)
IVB (max)
IVB (avg)
HM (max)
HM (avg)
Extension (avg)
Release Ht (avg)
Spin Score (max)
Zone %
Trackman - Splitter
72.1
Velocity (max)
64.8 - 71.4
Velo Range
67.4
Eff Velocity (avg)
674
Spin Rate (max)
1,302
Spin Rate (avg)
IVB (max)
IVB (avg)
HM (max)
HM (avg)
Extension (avg)
Release Ht (avg)
Spin Score (max)
Zone %
Pitch Scores
2024
2023
Fastball
Hop+
A fastball with hop has a flat approach angle and visually jumps through the zone. When thrown up in the zone, it is more likely to generate a higher swing and miss average. Hop+ of 100 is MLB average.
Fastball
Sink+
A fastball with sink has low backspin and drops through the strike zone. When thrown down in the zone, it is more likely to generate a higher ground ball percentage and lower launch angle. Sink+ of 100 is MLB average.
Fastball
Rise+
A fastball with rise has a high percentage of backspin. When thrown up in the zone, it is more likely to generate a higher fly ball percentage. Rise+ of 100 is MLB average
Slider
Hammer+
A hammer breaking ball drops vertically with velocity through the zone, or 12-to-6 movement. Hammer+ of 100 is MLB average.
Slider
Sweep+
A sweeping breaking ball moves horizontally with velocity through the zone. Sweep+ of 100 is MLB average.
Fastball
Hop+
A fastball with hop has a flat approach angle and visually jumps through the zone. When thrown up in the zone, it is more likely to generate a higher swing and miss average. Hop+ of 100 is MLB average.
Fastball
Sink+
A fastball with sink has low backspin and drops through the strike zone. When thrown down in the zone, it is more likely to generate a higher ground ball percentage and lower launch angle. Sink+ of 100 is MLB average.
Fastball
Rise+
A fastball with rise has a high percentage of backspin. When thrown up in the zone, it is more likely to generate a higher fly ball percentage. Rise+ of 100 is MLB average
Slider
Hammer+
A hammer breaking ball drops vertically with velocity through the zone, or 12-to-6 movement. Hammer+ of 100 is MLB average.
Slider
Sweep+
A sweeping breaking ball moves horizontally with velocity through the zone. Sweep+ of 100 is MLB average.
Pitching Velos
2024
2023
Fastball
Velocity Max
The maximum observed fastball velocity in the given event year. Measured in miles per hour (MPH).
92.0
Fastball
Velocity Avg
The average velocity for all pitches of this type in the given event year. Measured in miles per hour (MPH)
88.5
Changeup
Velocity Avg
The average velocity for all pitches of this type in the given event year. Measured in miles per hour (MPH)
78.0
Slider
Velocity Avg
The average velocity for all pitches of this type in the given event year. Measured in miles per hour (MPH)
74.0
Fastball
Velocity Max
The maximum observed fastball velocity in the given event year. Measured in miles per hour (MPH).
86.0
Fastball
Velocity Avg
The average velocity for all pitches of this type in the given event year. Measured in miles per hour (MPH)
84.8
Curveball
Velocity Avg
The average velocity for all pitches of this type in the given event year. Measured in miles per hour (MPH)
67.0
Changeup
Velocity Avg
The average velocity for all pitches of this type in the given event year. Measured in miles per hour (MPH)
77.0
Slider
Velocity Avg
The average velocity for all pitches of this type in the given event year. Measured in miles per hour (MPH)
72.5
Game Performance

2023
10 Yard Dash
The athlete's fastest 0-10-yard split time in the given event year. Measured in seconds.
1.69
30 Yard Dash
The athlete's fastest 0-30-yard split time in the given event year. Measured in seconds.
4.09
60 Yard Dash
The athlete's fastest 0-60-yard time in the given event year. Measured in seconds.
7.49
Top Speed (MPH)
The athlete's fastest split time converted to miles per hour.
Visual Edge

Pitch Ai

Notes
News
Comments
Draft Reports
Contact
Premium Content Area
To unlock contact information, you need to purchase a ScoutPLUS subscription.
Purchase Subscription OR
Login
Physical
2024
Grip Strgth (LH)
Grip strength is a measure of a players bat control and ability to transfer power and speed during impact, measured in pounds of force generated; collected with elbow bent at 90 degrees.
Grip Strgth (RH)
Grip strength is a measure of a players bat control and ability to transfer power and speed during impact, measured in pounds of force generated; collected with elbow bent at 90 degrees.


 Sign in to view rankings
Positional Profile: RHP
Body: 6-6, 209-pounds.
Delivery: Hybrid start, small steps into comfortable leg lift, stays tall in legs rotating down mound.
Arm Action: RH. Longer arm spiral into deep retraction, loose arm at 3/4 slot.
FB: T89, 84-89 mph. T2184, 2064 average rpm.
SL: 73-75 mph. T2105, 1995 average rpm.
CH: 77-79 mph. T1965, 1900 average rpm.
Positional Profile: RHP/3B Ranked 20th in MN 2025 class
Body: 6-5, 185-pounds.
Delivery: Squared and balanced, side step and turn, tall balance position, controlled delivery, swings down, lands inline
Arm Action: RH. Long arm swing down and behind, 3/4 slot
FB: T86, 83-85 mph. Run and sink T2225, 2125 average rpm.
SL: 72-73 mph. Tight, 10/4 late break T1917, 1840 average rpm.
CH: 76-78 mph. Fade action T1918, 1717 average rpm.
ATH: 7.49 runner in the 60. 1.69 and 4.09 in the 10 and 30 yard splits.
Jack Butterworth, Minnetonka (MN), 2025
Positional Profile: RHP/3B Ranked 20th in MN 2025 class
Body: 6-5, 185-pounds.
Delivery: Squared and balanced, side step and turn, tall balance position, controlled delivery, swings down, lands inline
Arm Action: RH. Long arm swing down and behind, 3/4 slot
FB: T86, 83-85 mph. Run and sink T2225, 2125 average rpm.
SL: 72-73 mph. Tight, 10/4 late break T1917, 1840 average rpm.
CH: 76-78 mph. Fade action T1918, 1717 average rpm.
ATH: 7.49 runner in the 60. 1.69 and 4.09 in the 10 and 30 yard splits.
Body: 6-4, 180-pounds.
Delivery: Squared start, side step and turn, high leg swing, long stride down the mound
Arm Action: RH. Long to short, hand comes down and back, slight shoulder tilt, 3/4 slot
FB: T86, 85-86 mph. Some down hill T2194, 2135 average rpm.
CB: 65-69 mph. 11/5 loose spin T1858, 1816 average rpm.
CH: 73-76 mph. Straight T1760, 1667 average rpm.
Positional Profile: RHP/3B
Body: 6-4, 180-pounds.
Delivery: Squared start, side step and turn, high leg swing, long stride down the mound
Arm Action: RH. Long to short, hand comes down and back, slight shoulder tilt, 3/4 slot
FB: T86, 85-86 mph. Some down hill T2194, 2135 average rpm.
CB: 65-69 mph. 11/5 loose spin T1858, 1816 average rpm.
CH: 73-76 mph. Straight T1760, 1667 average rpm.
Positional Profile: RHP
Body: 6-3, 145-pounds.
Delivery: High leg kick, lands open, falls off to the first base side.
Arm Action: RH. Long arm swing into compact action, ¾ slot.
FB: T79.2, 66.4-79.2 mph. T1948, 1449 average rpm. Straight, arm-side run at times.
SL: 70.5-78.6 mph. T2101, 1999 average rpm. 10/4 shape.
SPLT: 64.8-71.4 mph. T674, 1302 average rpm. Down action with some arm-side run.