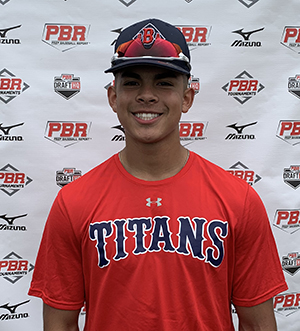
CLASS OF 2023
SS
RHP
Avery
Ortiz
Oklahoma State
Union (HS) • OK
6' 1" • 190LBS
R/R • 19yr 5mo
Travel Team: BBA Titans 16u 2023
Union (HS) • OK
6' 1" • 190LBS
R/R • 19yr 5mo
Travel Team: BBA Titans 16u 2023
Rankings
2023 National
Rankings available to Premium Subscriber
2023 State
Rankings available to Premium Subscriber
Commitment
Best Of Stats
22.9
Hand Speed (max)
7/28/21
85.2
Bat Speed (max)
7/28/21
23.4
Rot. Acc (max)
2/05/23
78
Hard Hit %
7/28/21
101.2
Exit Velocity (max)
2/05/23
94.2
Exit Velocity (avg)
2/05/23
380
Distance (max)
2/05/23
71
Sweet Spot %
2/05/23
6.71
60
6/02/21
3.79
30-yd
2/05/23
1.7
10-yd
2/05/23
20.5
Run speed (max)
2/05/23
89
INF Velo
6/02/21
-
OF Velo
-
C Velo
-
Pop Time
Fastball
91
Velocity (max)
7/28/21
88 - 90
Velo Range
7/28/21
-
Spin Rate (avg)
Changeup
80 - 81
Velo Range
6/02/21
-
Spin Rate (avg)
Curveball
77 - 79
Velo Range
7/28/21
-
Spin Rate (avg)
Slider
73 - 75
Velo Range
6/02/21
-
Spin Rate (avg)
Positional Tools
2023
2021
60 Yard Dash
The athlete's fastest 60-yard dash time in the given event year. Measured in seconds (s)
6.79
Infield Velocity
The athlete's maximum throwing velocity from an infield position in the given event year. Measured in miles per hour (MPH).
87.0
Power / Speed Score
A simple calculation that divides the athlete’s Exit Velocity Max by the athlete’s 60 Yard Dash time for the given event year. For example, 98 MPH / 7.00s = 14.00.
14.9
60 Yard Dash
The athlete's fastest 60-yard dash time in the given event year. Measured in seconds (s)
6.71
Infield Velocity
The athlete's maximum throwing velocity from an infield position in the given event year. Measured in miles per hour (MPH).
89.0
Power / Speed Score
A simple calculation that divides the athlete’s Exit Velocity Max by the athlete’s 60 Yard Dash time for the given event year. For example, 98 MPH / 7.00s = 14.00.
14.0
Hitting

2023
Exit Velocity Max
The highest exit velocity of any batted ball in the given event year. Measured in miles per hour (MPH).
101.2
Exit Velocity Avg
Average exit velocity of all batted balls in the given event year. Measured in miles per hour (MPH).
94.2
Distance Max
The highest flight distance of any batted ball in the given event year. Measured in feet (ft).
380
Distance Avg
Average flight distance of all batted balls in the given event year. Measured in feet (ft).
236
Launch Angle Avg
Average launch angle of all batted balls in the given event year. Measured in degrees.
15.4
Hard Hit %
Percentage of batted balls with exit velocities over 95 MPH in the given event year.
Sweet Spot %
Percentage of batted balls in the given event year with a launch angle between 8° and 32°.
Line Drive %
Percentage of batted balls with launch angles between 10 and 25 degrees in the given event year.
Fly Ball %
Percentage of batted balls with launch angles between 25 and 50 degrees in the given event year.
Ground Ball %
Percentage of batted balls with launch angles below 10 degrees in the given event year.
Super 60 Pro Showcase
Feb 5, 2023
Trackman - Hitting
101.2
Exit Velocity (max)
94.2
Exit Velocity (avg)
236
Distance (avg)
380
Distance (max)
Hard Hit %
Sweet Spot %
Line Drive %
Fly Ball %
Ground Ball %
2021 Future Games
Jul 28, 2021
Trackman - Hitting
97.1
Exit Velocity (max)
92.9
Exit Velocity (avg)
126
Distance (avg)
299
Distance (max)
Hard Hit %
Sweet Spot %
Line Drive %
Ground Ball %
CO/UT/OK/Select Workout Pod
Jul 28, 2021
Trackman - Hitting
97.1
Exit Velocity (max)
92.9
Exit Velocity (avg)
126
Distance (avg)
299
Distance (max)
Hard Hit %
Sweet Spot %
Line Drive %
Ground Ball %
Hitting

2023
2021
Hand Speed Max
The highest Peak Hand Speed of any swing in the given event year.
22.1
Hand Speed Avg
The average Peak Hand Speed for all swings in the given event year.
21.3
Bat Speed Max
The highest Bat Speed of any swing in the given event year.
78.2
Bat Speed Avg
The average Bat Speed for all swings in the given event year.
75.3
Rotational Acceleration Max
The highest Rotational Acceleration of any swing in the given event year.
Rotational Acceleration Avg
The average Rotational Acceleration for all swings in the given event year.
On-Plane Efficiency Max
The highest On-Plane Efficiency of any swing in the given event year.
On-Plane Efficiency Avg
The average On-Plane Efficiency for all swings in the given event year.
Hand Speed Max
The highest Peak Hand Speed of any swing in the given event year.
22.9
Hand Speed Avg
The average Peak Hand Speed for all swings in the given event year.
22.0
Bat Speed Max
The highest Bat Speed of any swing in the given event year.
85.2
Bat Speed Avg
The average Bat Speed for all swings in the given event year.
79.7
Rotational Acceleration Max
The highest Rotational Acceleration of any swing in the given event year.
Rotational Acceleration Avg
The average Rotational Acceleration for all swings in the given event year.
On-Plane Efficiency Max
The highest On-Plane Efficiency of any swing in the given event year.
On-Plane Efficiency Avg
The average On-Plane Efficiency for all swings in the given event year.
Super 60 Pro Showcase
Feb 5, 2023
Blast - Hitting
22.1
Hand Speed (max)
21.3
Hand Speed (avg)
78.2
Bat Speed (max)
75.3
Bat Speed (avg)
Rot. Acc (max)
Rot. Acc (avg)
On Plane Eff (avg)
MaxOnPlaneEfficiency
CO/UT/OK/Select Workout Pod
Jul 28, 2021
Blast - Hitting
22.9
Hand Speed (max)
22.0
Hand Speed (avg)
85.2
Bat Speed (max)
79.7
Bat Speed (avg)
Rot. Acc (max)
Rot. Acc (avg)
On Plane Eff (avg)
2021 Future Games
Jul 28, 2021
Blast - Hitting
22.9
Hand Speed (max)
22.0
Hand Speed (avg)
85.2
Bat Speed (max)
79.7
Bat Speed (avg)
Rot. Acc (max)
Rot. Acc (avg)
On Plane Eff (avg)
MaxOnPlaneEfficiency
Pitching

2021
Fastball
Velocity Max
The maximum observed fastball velocity in the given event year. Measured in miles per hour (MPH).
91.1
Fastball
Velocity Avg
The average velocity for all pitches of this type in the given event year. Measured in miles per hour (MPH).
88.1
Fastball
Spin Rate Avg
The average rate of spin for all pitches of this type in the given event year. Measured in rotations per minute (RPM).
2054
Fastball
Spin Score Avg
The average Bauer Units value of all fastballs in the given event year. Bauer Units are calculated for each pitch by dividing Spin Rate by Velocity.
23.4
Curveball
Velocity Avg
The average velocity for all pitches of this type in the given event year. Measured in miles per hour (MPH).
77.7
Curveball
Spin Rate Avg
The average rate of spin for all pitches of this type in the given event year. Measured in rotations per minute (RPM).
2136
Slider
Velocity Avg
The average velocity for all pitches of this type in the given event year. Measured in miles per hour (MPH).
74.2
Slider
Spin Rate Avg
The average rate of spin for all pitches of this type in the given event year. Measured in rotations per minute (RPM).
2161
2021 Future Games
Jul 28, 2021
Trackman - Fastball
91.1
Velocity (max)
85.0 - 91.1
Velo Range
84.5
Eff Velocity (avg)
2,261
Spin Rate (max)
2,054
Spin Rate (avg)
Spin Score (max)
Trackman - Curveball
78.5
Velocity (max)
77.1 - 78.4
Velo Range
74.9
Eff Velocity (avg)
2,175
Spin Rate (max)
2,136
Spin Rate (avg)
Spin Score (max)
Trackman - Slider
74.2
Velocity (max)
71.5
Eff Velocity (avg)
2,161
Spin Rate (max)
2,161
Spin Rate (avg)
Spin Score (max)
Pitch Scores
Pitching Velos
2021
Fastball
Velocity Max
The maximum observed fastball velocity in the given event year. Measured in miles per hour (MPH).
91.0
Fastball
Velocity Avg
The average velocity for all pitches of this type in the given event year. Measured in miles per hour (MPH)
88.2
Curveball
Velocity Avg
The average velocity for all pitches of this type in the given event year. Measured in miles per hour (MPH)
78.0
Changeup
Velocity Avg
The average velocity for all pitches of this type in the given event year. Measured in miles per hour (MPH)
80.5
Slider
Velocity Avg
The average velocity for all pitches of this type in the given event year. Measured in miles per hour (MPH)
74.0
Game Performance

Visual Edge

2021
Edge Score
The highest Edge Score within the given year. Edge Score is a comprehensive score that takes the core-six visual skills into account, providing an assessment of an athlete’s overall visual ability.
78.27
Pitch Ai

Notes
News
- PBR OK Scout Blog: Second Edition - Apr 4, 2023
- PBR OK Scout Blog: First Edition - Mar 14, 2023
- Super 60: Blast Motion identifies its statistical stand-outs - Feb 14, 2023
- 2023 Super 60: Statistical Analysis - Feb 8, 2023
- Kansas City Program Invitational: Top Prospects - Jul 6, 2022
- 2023 Rankings: MOKan Names to Know - May 20, 2022
- PBR Future Games: Top 25 Impact '23s - Aug 8, 2021
- 2021 Future Games: College Commitment Tracker - Aug 3, 2021
- Shooter's Rapid Reaction: Workout Day - 20 Names to Know - Jul 29, 2021
- Top Position Players Coming to Future Games - Jul 14, 2021
- OSSAA 6A Regional Preview: Union Regional - May 3, 2021
- OK Scout Blog: Week 4 - Mar 29, 2021
- OK Spring Scout Blog: Week 2 - Mar 15, 2021
Comments
Draft Reports
Contact
Premium Content Area
To unlock contact information, you need to purchase a ScoutPLUS subscription.
Purchase Subscription OR
Login


 Sign in to view rankings
Arguably the tournament’s top prospect, Ortiz’s ascent as a nationally-recognized prospect continues after a scorching hot high school season has parlayed into early summer success. The Oklahoma State commit launched 17 home runs for Union during the OHSAA season, bringing that seemingly effortless power to Creekside this past weekend. Ortiz scolded balls off the barrel in what seemed like every plate appearance, playing pepper with the outfield gaps prior to launching a no-doubt home run in BBA’s final pool game. His ability to find the barrel at the rate that he does is impressive and it’s largely in part to the upper-tier athletic profile that Ortiz possesses. Should Ortiz continue to perform at the rate that he has, expect his prospect status and draft stock to soar as the summer circuit comes to an end.
The 2023 infielder/rhp had quite the coming out party on the national stage. It started in the workout day where Ortiz ran a 6.73 60 to go along with his 89 mph arm across the diamond. IN the Loden physical testing Ortiz ranks among the top 1% of all athletes they have ever tested showing how physically gifted he is to go along with his baseball skills. During the games Ortiz put his elite bat speed on display picking up a couple of hits and to go along with some loud outs. He showcased his smooth fielding and dynamic range in the infield playing all three spots. He also jumped on the mound for one inning on Thursday and one inning on Saturday where the fastball worked up to 91 mph and the slider up to 79 mph with tight action and spin.