CLASS OF 2025
SS
RHP
Carson
Brumbaugh
Edmond Santa Fe (HS) • OK
 6' 2" • 192.7LBS
R/R • 18yr 2mo
Travel Team: OK Fuel
R/R • 18yr 2mo
Travel Team: OK Fuel
Rankings
2025 National
Rankings available to Premium Subscriber
2025 State
Rankings available to Premium Subscriber
Commitment
Best Of Stats
28.4
Hand Speed (max)
9/21/23
83.1
Bat Speed (max)
7/26/23
46.4
Rot. Acc (max)
7/26/23
100
Hard Hit %
7/26/23
103.6
Exit Velocity (max)
7/26/23
97.9
Exit Velocity (avg)
7/26/23
395
Distance (max)
9/21/23
85
Sweet Spot %
7/26/23
6.74
60
9/21/23
3.77
30-yd
9/21/23
1.66
10-yd
9/21/23
20.6
Run speed (max)
9/21/23
96
INF Velo
9/21/23
-
OF Velo
-
C Velo
-
Pop Time
Fastball
96
Velocity (max)
8/03/23
93 - 96
Velo Range
8/03/23
1887
Spin Rate (avg)
7/26/23
Changeup
84.6 - 86.4
Velo Range
7/26/23
1675
Spin Rate (avg)
7/26/23
Curveball
76 - 80
Velo Range
6/22/23
2050
Spin Rate (avg)
7/26/23
Slider
81 - 82
Velo Range
8/03/23
-
Spin Rate (avg)
Positional Tools
2023
2022
2021
60 Yard Dash
The athlete's fastest 60-yard dash time in the given event year. Measured in seconds (s)
6.74
Infield Velocity
The athlete's maximum throwing velocity from an infield position in the given event year. Measured in miles per hour (MPH).
96.0
Power / Speed Score
A simple calculation that divides the athlete’s Exit Velocity Max by the athlete’s 60 Yard Dash time for the given event year. For example, 98 MPH / 7.00s = 14.00.
15.4
Home to First
The athlete's fastest home-to-first time in the given event year. Measured from bat-on-ball to foot-on-bag, in seconds (s).
4.84
Infield Velocity
The athlete's maximum throwing velocity from an infield position in the given event year. Measured in miles per hour (MPH).
90.0
60 Yard Dash
The athlete's fastest 60-yard dash time in the given event year. Measured in seconds (s)
7.31
Infield Velocity
The athlete's maximum throwing velocity from an infield position in the given event year. Measured in miles per hour (MPH).
76.0
Power / Speed Score
A simple calculation that divides the athlete’s Exit Velocity Max by the athlete’s 60 Yard Dash time for the given event year. For example, 98 MPH / 7.00s = 14.00.
12.0
Hitting

2023
2022
Exit Velocity Max
The highest exit velocity of any batted ball in the given event year. Measured in miles per hour (MPH).
103.6
Exit Velocity Avg
Average exit velocity of all batted balls in the given event year. Measured in miles per hour (MPH).
94.3
Distance Max
The highest flight distance of any batted ball in the given event year. Measured in feet (ft).
395
Distance Avg
Average flight distance of all batted balls in the given event year. Measured in feet (ft).
214
Launch Angle Avg
Average launch angle of all batted balls in the given event year. Measured in degrees.
15.5
Hard Hit %
Percentage of batted balls with exit velocities over 95 MPH in the given event year.
Sweet Spot %
Percentage of batted balls in the given event year with a launch angle between 8° and 32°.
Line Drive %
Percentage of batted balls with launch angles between 10 and 25 degrees in the given event year.
Fly Ball %
Percentage of batted balls with launch angles between 25 and 50 degrees in the given event year.
Ground Ball %
Percentage of batted balls with launch angles below 10 degrees in the given event year.
Exit Velocity Max
The highest exit velocity of any batted ball in the given event year. Measured in miles per hour (MPH).
96.8
Exit Velocity Avg
Average exit velocity of all batted balls in the given event year. Measured in miles per hour (MPH).
91.8
Distance Max
The highest flight distance of any batted ball in the given event year. Measured in feet (ft).
368
Distance Avg
Average flight distance of all batted balls in the given event year. Measured in feet (ft).
305
Launch Angle Avg
Average launch angle of all batted balls in the given event year. Measured in degrees.
29.1
Hard Hit %
Percentage of batted balls with exit velocities over 95 MPH in the given event year.
Sweet Spot %
Percentage of batted balls in the given event year with a launch angle between 8° and 32°.
Line Drive %
Percentage of batted balls with launch angles between 10 and 25 degrees in the given event year.
Fly Ball %
Percentage of batted balls with launch angles between 25 and 50 degrees in the given event year.
Ground Ball %
Percentage of batted balls with launch angles below 10 degrees in the given event year.
2023 PBR All-American Game
Sep 21, 2023
Trackman - Hitting
102.5
Exit Velocity (max)
94.3
Exit Velocity (avg)
236
Distance (avg)
395
Distance (max)
Hard Hit %
Barrel %
Sweet Spot %
Line Drive %
Fly Ball %
Ground Ball %
FG Workout CO/UT/OK/Select
Jul 26, 2023
Trackman - Hitting
103.6
Exit Velocity (max)
97.9
Exit Velocity (avg)
298
Distance (avg)
391
Distance (max)
Hard Hit %
Barrel %
Sweet Spot %
Line Drive %
Fly Ball %
Ground Ball %
2023 PBR Future Games
Jul 26, 2023
Trackman - Hitting
103.6
Exit Velocity (max)
97.9
Exit Velocity (avg)
298
Distance (avg)
391
Distance (max)
Hard Hit %
Barrel %
Sweet Spot %
Line Drive %
Fly Ball %
Ground Ball %
Preseason All-State
Feb 12, 2023
Trackman - Hitting
100.4
Exit Velocity (max)
91.4
Exit Velocity (avg)
110
Distance (avg)
260
Distance (max)
Hard Hit %
Sweet Spot %
Line Drive %
Fly Ball %
Ground Ball %
2022 PBR Future Games
Jul 27, 2022
Trackman - Hitting
101.7
Exit Velocity (max)
95.3
Exit Velocity (avg)
295
Distance (avg)
376
Distance (max)
Hard Hit %
Sweet Spot %
Line Drive %
Fly Ball %
Ground Ball %
Top Prospect Games: Underclass (Invite-Only)
Jun 14, 2022
Trackman - Hitting
96.8
Exit Velocity (max)
91.8
Exit Velocity (avg)
305
Distance (avg)
368
Distance (max)
Hard Hit %
Sweet Spot %
Line Drive %
Fly Ball %
Hitting

2023
2022
Hand Speed Max
The highest Peak Hand Speed of any swing in the given event year.
28.4
Hand Speed Avg
The average Peak Hand Speed for all swings in the given event year.
23.9
Bat Speed Max
The highest Bat Speed of any swing in the given event year.
83.1
Bat Speed Avg
The average Bat Speed for all swings in the given event year.
73.3
Rotational Acceleration Max
The highest Rotational Acceleration of any swing in the given event year.
Rotational Acceleration Avg
The average Rotational Acceleration for all swings in the given event year.
On-Plane Efficiency Max
The highest On-Plane Efficiency of any swing in the given event year.
On-Plane Efficiency Avg
The average On-Plane Efficiency for all swings in the given event year.
Hand Speed Max
The highest Peak Hand Speed of any swing in the given event year.
28.3
Hand Speed Avg
The average Peak Hand Speed for all swings in the given event year.
25.2
Bat Speed Max
The highest Bat Speed of any swing in the given event year.
79.2
Bat Speed Avg
The average Bat Speed for all swings in the given event year.
72.0
Rotational Acceleration Max
The highest Rotational Acceleration of any swing in the given event year.
Rotational Acceleration Avg
The average Rotational Acceleration for all swings in the given event year.
On-Plane Efficiency Max
The highest On-Plane Efficiency of any swing in the given event year.
On-Plane Efficiency Avg
The average On-Plane Efficiency for all swings in the given event year.
2023 PBR All-American Game
Sep 21, 2023
Blast - Hitting
28.4
Hand Speed (max)
26.0
Hand Speed (avg)
79.6
Bat Speed (max)
77.3
Bat Speed (avg)
Rot. Acc (max)
Rot. Acc (avg)
On Plane Eff (avg)
MaxOnPlaneEfficiency
2023 PBR Future Games
Jul 26, 2023
Blast - Hitting
28.0
Hand Speed (max)
26.9
Hand Speed (avg)
83.1
Bat Speed (max)
77.9
Bat Speed (avg)
Rot. Acc (max)
Rot. Acc (avg)
On Plane Eff (avg)
MaxOnPlaneEfficiency
Preseason All-State
Feb 12, 2023
Blast - Hitting
27.2
Hand Speed (max)
21.9
Hand Speed (avg)
79.9
Bat Speed (max)
70.1
Bat Speed (avg)
Rot. Acc (max)
Rot. Acc (avg)
On Plane Eff (avg)
MaxOnPlaneEfficiency
2022 PBR Future Games
Jul 27, 2022
Blast - Hitting
25.3
Hand Speed (max)
24.4
Hand Speed (avg)
79.2
Bat Speed (max)
76.3
Bat Speed (avg)
Rot. Acc (max)
Rot. Acc (avg)
On Plane Eff (avg)
MaxOnPlaneEfficiency
Top Prospect Games: Underclass (Invite-Only)
Jun 14, 2022
Blast - Hitting
28.3
Hand Speed (max)
27.0
Hand Speed (avg)
68.2
Bat Speed (max)
63.5
Bat Speed (avg)
Rot. Acc (max)
Rot. Acc (avg)
On Plane Eff (avg)
MaxOnPlaneEfficiency
Pitching

2023
Fastball
Velocity Max
The maximum observed fastball velocity in the given event year. Measured in miles per hour (MPH).
93.2
Fastball
Velocity Avg
The average velocity for all pitches of this type in the given event year. Measured in miles per hour (MPH).
91.1
Fastball
Spin Rate Avg
The average rate of spin for all pitches of this type in the given event year. Measured in rotations per minute (RPM).
1887
Fastball
Spin Score Avg
The average Bauer Units value of all fastballs in the given event year. Bauer Units are calculated for each pitch by dividing Spin Rate by Velocity.
20.7
Fastball
Total Movement Avg
The average total non-gravity movement for all pitches of this type in the given event year. Measured in inches (in).
Curveball
Velocity Avg
The average velocity for all pitches of this type in the given event year. Measured in miles per hour (MPH).
77.8
Curveball
Spin Rate Avg
The average rate of spin for all pitches of this type in the given event year. Measured in rotations per minute (RPM).
2050
Curveball
Total Movement Avg
The average total non-gravity movement for all pitches of this type in the given event year. Measured in inches (in).
Changeup
Velocity Avg
The average velocity for all pitches of this type in the given event year. Measured in miles per hour (MPH).
85.5
Changeup
Spin Rate Avg
The average rate of spin for all pitches of this type in the given event year. Measured in rotations per minute (RPM).
1675
Changeup
Total Movement Avg
The average total non-gravity movement for all pitches of this type in the given event year. Measured in inches (in).
2023 PBR Future Games
Jul 26, 2023
Trackman - Fastball
93.2
Velocity (max)
89.3 - 92.9
Velo Range
91.0
Eff Velocity (avg)
2,147
Spin Rate (max)
1,887
Spin Rate (avg)
IVB (max)
IVB (avg)
HM (max)
HM (avg)
Extension (avg)
Release Ht (avg)
Spin Score (max)
Zone %
Trackman - Curveball
80.3
Velocity (max)
76.6 - 79.1
Velo Range
76.9
Eff Velocity (avg)
2,178
Spin Rate (max)
2,050
Spin Rate (avg)
IVB (max)
IVB (avg)
HM (max)
HM (avg)
Extension (avg)
Release Ht (avg)
Spin Score (max)
Zone %
Trackman - ChangeUp
86.4
Velocity (max)
84.6 - 86.4
Velo Range
85.6
Eff Velocity (avg)
1,800
Spin Rate (max)
1,675
Spin Rate (avg)
IVB (max)
IVB (avg)
HM (max)
HM (avg)
Extension (avg)
Release Ht (avg)
Spin Score (max)
Zone %
Pitch Scores
Pitching Velos
2023
Fastball
Velocity Max
The maximum observed fastball velocity in the given event year. Measured in miles per hour (MPH).
96.0
Fastball
Velocity Avg
The average velocity for all pitches of this type in the given event year. Measured in miles per hour (MPH)
92.5
Curveball
Velocity Avg
The average velocity for all pitches of this type in the given event year. Measured in miles per hour (MPH)
78.0
Slider
Velocity Avg
The average velocity for all pitches of this type in the given event year. Measured in miles per hour (MPH)
81.5
Game Performance

2023
10 Yard Dash
The athlete's fastest 0-10-yard split time in the given event year. Measured in seconds.
1.66
30 Yard Dash
The athlete's fastest 0-30-yard split time in the given event year. Measured in seconds.
3.77
60 Yard Dash
The athlete's fastest 0-60-yard time in the given event year. Measured in seconds.
6.74
Top Speed (MPH)
The athlete's fastest split time converted to miles per hour.
RSi
The reactive strength index measurement of an athlete's explosiveness by comparing their jump height to the ground contact time in between their jumps. On a scale of 0-5.
Vertical Jump
A measure of any athlete's body strength and reach calculated from the flight time divided by the contact time.
2023 PBR All-American Game
Sep 21, 2023
Swift
1.66
10-yd
3.77
30-yd
6.74
60-yd
20.6
Run speed (max)
1.99
RSi (max)
29.5
Jump Height (max)
24.7
Jump Height (avg)
2022 PBR Future Games
Jul 27, 2022
Swift
1.71
10-yd
3.90
30-yd
7.00
60-yd
19.7
Run speed (max)
8.6
Run Speed (avg)
2.21
RSi (max)
2.21
RSi (avg)
1,627
Jump Power (max)
28.2
Jump Height (max)
28.1
Jump Height (avg)
Visual Edge

2023
2022
Edge Score
The highest Edge Score within the given year. Edge Score is a comprehensive score that takes the core-six visual skills into account, providing an assessment of an athlete’s overall visual ability.
83.47
Edge Score
The highest Edge Score within the given year. Edge Score is a comprehensive score that takes the core-six visual skills into account, providing an assessment of an athlete’s overall visual ability.
77.08
Pitch Ai

Notes
News
- Oklahoma Class of 2025 Rankings Update: Fall Edition - Nov 20, 2024
- OK 2025 Rankings Update: Summer Edition - Aug 27, 2024
- 2025 Rankings Update: 20 Picks to Click - Dec 1, 2023
- 2023 All-American Game: Tools of the Trade - Oct 5, 2023
- 2023 All-American Weekend: Workout Day, Data Dive - Sep 25, 2023
- 2023 PBR All-American Game, Spotlight: Carson Brumbaugh - Aug 22, 2023
- Area Codes Underclass: Impact 60 (White Sox) - Aug 16, 2023
- Fab 50: Shooter's Future Games Standouts (1-26) - Aug 11, 2023
- PBR OK Scout Blog: Second Edition - Apr 4, 2023
- PBR OK Scout Blog: First Edition - Mar 14, 2023
- Heart of America Hotlist: Preseason All-State Attendees - Jan 19, 2023
- Kansas City Program Invitational: Top Prospects - Jul 6, 2022
Comments
Draft Reports
Contact
Premium Content Area
To unlock contact information, you need to purchase a ScoutPLUS subscription.
Purchase Subscription OR
Login
Physical
2023
Grip Strgth (LH)
Grip strength is a measure of a players bat control and ability to transfer power and speed during impact, measured in pounds of force generated; collected with elbow bent at 90 degrees.
Grip Strgth (RH)
Grip strength is a measure of a players bat control and ability to transfer power and speed during impact, measured in pounds of force generated; collected with elbow bent at 90 degrees.









 Sign in to view rankings
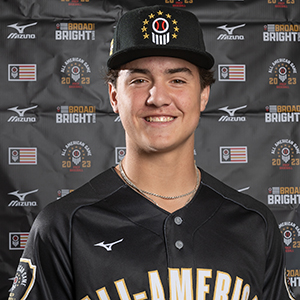
Prep Baseball All-American Game: Some of the loudest two-ways tools in the entire class, and maybe of the loudest tools overall. Brumbaugh, who’s been up to 96 with a wipeout slider this summer and fall was just hitting and defense this week, but that’s where the tools get freaky. Elite twitch with top-of-the-class hand and bat speed that’s backed by some of the best rotational acceleration that we’ve recorded in recent years. You add in the present barrel feel and there’s immense power projection for the Stillwater HS product. Athletic actions and soft hands on the left side of the infield with double-plus arm strength (96 INF) that gets easy carry across the diamond will allow the uncommitted SS/RHP to stick in the dirt. A true toolshed athlete who’s also an above-average runner as well.
A two-way follow in Oklahoma’s incoming sophomore class, Brumbaugh was a top performer from this past weekend’s event. He toed the rubber on Friday morning and punched out seven batters through four scoreless innings, touching 85 mph with his fastball from a live arm. His athleticism at the plate is obvious and so is his knack for hitting, driving in three runs in the same game that he excelled on the mound. Brumbaugh is one of five 2025 prospects currently on Team Oklahoma’s Future Games roster.
Positional Profile: SS
Body: 6-foot-2, 180-pounds. Athletic and physical build with present strength and room for added more in the future.
Hit: RHH. Slightly open stance with an athletic posture. Hands work easy into position with a knee knock stride. Shows advanced bat speed and very quick hands through the zone. Matches plane with the pitch well and shows the ability to drive the ball to all fields. Shows advanced strength at contact reaching maximum extension repeatably. Maintains good body control throughout the swing and repeats mechanics well.
Defense: In the infield attacks the ball with active feet and feel for routes working around the ball. Plays underneath the ball well with very soft hands and strong glove action. Fields the ball on the move well and shows clean exchanges out of the glove. Advanced feel for the shortstop position. Registered 85 mph across the diamond.
Run: 4.84 runner home to first.