CLASS OF 2025
3B
SS
Xavier
Neyens
Mount Vernon (HS) • WA
 6' 2" • 202.8LBS
L/R • 18yr
Travel Team: Trosky National
L/R • 18yr
Travel Team: Trosky National
Rankings
2025 National
Rankings available to Premium Subscriber
2025 State
Rankings available to Premium Subscriber
Commitment
Best Of Stats
26
Hand Speed (max)
7/12/23
89.2
Bat Speed (max)
7/12/23
27.5
Rot. Acc (max)
7/12/23
80
Hard Hit %
10/09/21
110.6
Exit Velocity (max)
9/12/24
95.3
Exit Velocity (avg)
9/12/24
424
Distance (max)
9/12/24
80
Sweet Spot %
10/09/21
6.87
60
9/12/24
3.92
30-yd
7/12/23
1.72
10-yd
7/12/23
19.7
Run speed (max)
7/12/23
90
INF Velo
7/12/23
93
OF Velo
7/12/23
75
C Velo
2/17/21
2.05 - 2.11
Pop Time
2/17/21
Fastball
93
Velocity (max)
8/09/23
90 - 92
Velo Range
8/09/23
2175
Spin Rate (avg)
10/09/21
Changeup
77.4 - 78.5
Velo Range
10/09/21
1822
Spin Rate (avg)
10/09/21
Curveball
71.2 - 73.7
Velo Range
10/09/21
2092
Spin Rate (avg)
10/09/21
Slider
73 - 75
Velo Range
3/18/23
1954
Spin Rate (avg)
7/08/20
Positional Tools
2024
2023
2021
2020
2019
60 Yard Dash
The athlete's fastest 60-yard dash time in the given event year. Measured in seconds (s)
6.87
Infield Velocity
The athlete's maximum throwing velocity from an infield position in the given event year. Measured in miles per hour (MPH).
88.0
Power / Speed Score
A simple calculation that divides the athlete’s Exit Velocity Max by the athlete’s 60 Yard Dash time for the given event year. For example, 98 MPH / 7.00s = 14.00.
16.1
Infield Velocity
The athlete's maximum throwing velocity from an infield position in the given event year. Measured in miles per hour (MPH).
90.0
Outfield Velocity
The athlete's maximum throwing velocity from an outfield position in the given event year. Measured in miles per hour (MPH).
93.0
60 Yard Dash
The athlete's fastest 60-yard dash time in the given event year. Measured in seconds (s)
7.51
Pop Time
The athlete's fastest pop time in the given event year. Measured from glove to glove, in seconds (s).
2.05 - 2.11
Catcher Velocity
The athlete's maximum throwing velocity from the catcher position in the given event year. Measured in miles per hour (MPH).
75.0
Infield Velocity
The athlete's maximum throwing velocity from an infield position in the given event year. Measured in miles per hour (MPH).
86.0
Power / Speed Score
A simple calculation that divides the athlete’s Exit Velocity Max by the athlete’s 60 Yard Dash time for the given event year. For example, 98 MPH / 7.00s = 14.00.
13.1
60 Yard Dash
The athlete's fastest 60-yard dash time in the given event year. Measured in seconds (s)
8.10
Pop Time
The athlete's fastest pop time in the given event year. Measured from glove to glove, in seconds (s).
2.15 - 2.40
Catcher Velocity
The athlete's maximum throwing velocity from the catcher position in the given event year. Measured in miles per hour (MPH).
70.0
Infield Velocity
The athlete's maximum throwing velocity from an infield position in the given event year. Measured in miles per hour (MPH).
77.0
Power / Speed Score
A simple calculation that divides the athlete’s Exit Velocity Max by the athlete’s 60 Yard Dash time for the given event year. For example, 98 MPH / 7.00s = 14.00.
10.4
60 Yard Dash
The athlete's fastest 60-yard dash time in the given event year. Measured in seconds (s)
8.70
Pop Time
The athlete's fastest pop time in the given event year. Measured from glove to glove, in seconds (s).
2.30 - 2.50
Catcher Velocity
The athlete's maximum throwing velocity from the catcher position in the given event year. Measured in miles per hour (MPH).
70.0
Power / Speed Score
A simple calculation that divides the athlete’s Exit Velocity Max by the athlete’s 60 Yard Dash time for the given event year. For example, 98 MPH / 7.00s = 14.00.
8.7
Northwest Pre-Season Invite (Underclass)
Feb 17, 2021
Position
7.56
60-yard
2.05 - 2.11
Pop Time
82
INF Velo
75
C Velo
95
Exit Velo
Power Speed Score
Washington Summer Kickoff
Jul 8, 2020
Position
8.30
60-yard
2.20 - 2.40
Pop Time
74
INF Velo
70
C Velo
84
Exit Velo
Power Speed Score
Hitting

2024
2023
2021
2020
Exit Velocity Max
The highest exit velocity of any batted ball in the given event year. Measured in miles per hour (MPH).
110.6
Exit Velocity Avg
Average exit velocity of all batted balls in the given event year. Measured in miles per hour (MPH).
95.3
Distance Max
The highest flight distance of any batted ball in the given event year. Measured in feet (ft).
424
Distance Avg
Average flight distance of all batted balls in the given event year. Measured in feet (ft).
346
Launch Angle Avg
Average launch angle of all batted balls in the given event year. Measured in degrees.
32.1
Hard Hit %
Percentage of batted balls with exit velocities over 95 MPH in the given event year.
Sweet Spot %
Percentage of batted balls in the given event year with a launch angle between 8° and 32°.
Line Drive %
Percentage of batted balls with launch angles between 10 and 25 degrees in the given event year.
Fly Ball %
Percentage of batted balls with launch angles between 25 and 50 degrees in the given event year.
Ground Ball %
Percentage of batted balls with launch angles below 10 degrees in the given event year.
Exit Velocity Max
The highest exit velocity of any batted ball in the given event year. Measured in miles per hour (MPH).
102.0
Exit Velocity Avg
Average exit velocity of all batted balls in the given event year. Measured in miles per hour (MPH).
93.4
Distance Max
The highest flight distance of any batted ball in the given event year. Measured in feet (ft).
401
Distance Avg
Average flight distance of all batted balls in the given event year. Measured in feet (ft).
292
Launch Angle Avg
Average launch angle of all batted balls in the given event year. Measured in degrees.
29.2
Hard Hit %
Percentage of batted balls with exit velocities over 95 MPH in the given event year.
Sweet Spot %
Percentage of batted balls in the given event year with a launch angle between 8° and 32°.
Line Drive %
Percentage of batted balls with launch angles between 10 and 25 degrees in the given event year.
Fly Ball %
Percentage of batted balls with launch angles between 25 and 50 degrees in the given event year.
Ground Ball %
Percentage of batted balls with launch angles below 10 degrees in the given event year.
Exit Velocity Max
The highest exit velocity of any batted ball in the given event year. Measured in miles per hour (MPH).
98.1
Exit Velocity Avg
Average exit velocity of all batted balls in the given event year. Measured in miles per hour (MPH).
89.4
Distance Max
The highest flight distance of any batted ball in the given event year. Measured in feet (ft).
378
Distance Avg
Average flight distance of all batted balls in the given event year. Measured in feet (ft).
234
Launch Angle Avg
Average launch angle of all batted balls in the given event year. Measured in degrees.
20.3
Hard Hit %
Percentage of batted balls with exit velocities over 95 MPH in the given event year.
Sweet Spot %
Percentage of batted balls in the given event year with a launch angle between 8° and 32°.
Line Drive %
Percentage of batted balls with launch angles between 10 and 25 degrees in the given event year.
Fly Ball %
Percentage of batted balls with launch angles between 25 and 50 degrees in the given event year.
Ground Ball %
Percentage of batted balls with launch angles below 10 degrees in the given event year.
Exit Velocity Max
The highest exit velocity of any batted ball in the given event year. Measured in miles per hour (MPH).
84.0
Exit Velocity Avg
Average exit velocity of all batted balls in the given event year. Measured in miles per hour (MPH).
78.7
Distance Max
The highest flight distance of any batted ball in the given event year. Measured in feet (ft).
284
Distance Avg
Average flight distance of all batted balls in the given event year. Measured in feet (ft).
168
Launch Angle Avg
Average launch angle of all batted balls in the given event year. Measured in degrees.
15.0
Hard Hit %
Percentage of batted balls with exit velocities over 95 MPH in the given event year.
Sweet Spot %
Percentage of batted balls in the given event year with a launch angle between 8° and 32°.
Line Drive %
Percentage of batted balls with launch angles between 10 and 25 degrees in the given event year.
Fly Ball %
Percentage of batted balls with launch angles between 25 and 50 degrees in the given event year.
Ground Ball %
Percentage of batted balls with launch angles below 10 degrees in the given event year.
2024 Prep Baseball All-American Game
Sep 12, 2024
Trackman - Hitting
110.6
Exit Velocity (max)
95.3
Exit Velocity (avg)
346
Distance (avg)
424
Distance (max)
Hard Hit %
Barrel %
Sweet Spot %
Line Drive %
Fly Ball %
Seattle Summer Open II
Jul 12, 2023
Trackman - Hitting
102.0
Exit Velocity (max)
93.4
Exit Velocity (avg)
292
Distance (avg)
401
Distance (max)
Hard Hit %
Barrel %
Sweet Spot %
Line Drive %
Fly Ball %
Ground Ball %
Upperclass Fall Showcase
Oct 9, 2021
Trackman - Hitting
98.1
Exit Velocity (max)
91.6
Exit Velocity (avg)
252
Distance (avg)
378
Distance (max)
Hard Hit %
Sweet Spot %
Line Drive %
Fly Ball %
Ground Ball %
Northwest Pre-Season Invite (Underclass)
Feb 17, 2021
Trackman - Hitting
95.9
Exit Velocity (max)
86.6
Exit Velocity (avg)
210
Distance (avg)
314
Distance (max)
Hard Hit %
Sweet Spot %
Line Drive %
Fly Ball %
Ground Ball %
Washington Summer Kickoff
Jul 8, 2020
Trackman - Hitting
84.0
Exit Velocity (max)
78.7
Exit Velocity (avg)
168
Distance (avg)
284
Distance (max)
Sweet Spot %
Line Drive %
Fly Ball %
Ground Ball %
Hitting

2024
2023
2021
Hand Speed Max
The highest Peak Hand Speed of any swing in the given event year.
22.9
Hand Speed Avg
The average Peak Hand Speed for all swings in the given event year.
21.1
Bat Speed Max
The highest Bat Speed of any swing in the given event year.
84.8
Bat Speed Avg
The average Bat Speed for all swings in the given event year.
78.1
Rotational Acceleration Max
The highest Rotational Acceleration of any swing in the given event year.
Rotational Acceleration Avg
The average Rotational Acceleration for all swings in the given event year.
On-Plane Efficiency Max
The highest On-Plane Efficiency of any swing in the given event year.
On-Plane Efficiency Avg
The average On-Plane Efficiency for all swings in the given event year.
Hand Speed Max
The highest Peak Hand Speed of any swing in the given event year.
26.0
Hand Speed Avg
The average Peak Hand Speed for all swings in the given event year.
24.1
Bat Speed Max
The highest Bat Speed of any swing in the given event year.
89.2
Bat Speed Avg
The average Bat Speed for all swings in the given event year.
83.4
Rotational Acceleration Max
The highest Rotational Acceleration of any swing in the given event year.
Rotational Acceleration Avg
The average Rotational Acceleration for all swings in the given event year.
On-Plane Efficiency Max
The highest On-Plane Efficiency of any swing in the given event year.
On-Plane Efficiency Avg
The average On-Plane Efficiency for all swings in the given event year.
Hand Speed Max
The highest Peak Hand Speed of any swing in the given event year.
23.5
Hand Speed Avg
The average Peak Hand Speed for all swings in the given event year.
21.6
Bat Speed Max
The highest Bat Speed of any swing in the given event year.
82.5
Bat Speed Avg
The average Bat Speed for all swings in the given event year.
73.8
Rotational Acceleration Max
The highest Rotational Acceleration of any swing in the given event year.
Rotational Acceleration Avg
The average Rotational Acceleration for all swings in the given event year.
On-Plane Efficiency Max
The highest On-Plane Efficiency of any swing in the given event year.
On-Plane Efficiency Avg
The average On-Plane Efficiency for all swings in the given event year.
2024 Prep Baseball All-American Game
Sep 12, 2024
Blast - Hitting
22.9
Hand Speed (max)
21.1
Hand Speed (avg)
84.8
Bat Speed (max)
78.1
Bat Speed (avg)
Rot. Acc (max)
Rot. Acc (avg)
On Plane Eff (avg)
MaxOnPlaneEfficiency
Seattle Summer Open II
Jul 12, 2023
Blast - Hitting
26.0
Hand Speed (max)
24.1
Hand Speed (avg)
89.2
Bat Speed (max)
83.4
Bat Speed (avg)
Rot. Acc (max)
Rot. Acc (avg)
On Plane Eff (avg)
MaxOnPlaneEfficiency
Upperclass Fall Showcase
Oct 9, 2021
Blast - Hitting
23.5
Hand Speed (max)
22.1
Hand Speed (avg)
78.8
Bat Speed (max)
74.3
Bat Speed (avg)
Rot. Acc (max)
Rot. Acc (avg)
On Plane Eff (avg)
MaxOnPlaneEfficiency
Northwest Pre-Season Invite (Underclass)
Feb 17, 2021
Blast - Hitting
22.6
Hand Speed (max)
20.8
Hand Speed (avg)
82.5
Bat Speed (max)
73.1
Bat Speed (avg)
Rot. Acc (max)
Rot. Acc (avg)
On Plane Eff (avg)
MaxOnPlaneEfficiency
Washington Summer Kickoff
Jul 8, 2020
Blast - Hitting
20.4
Hand Speed (max)
19.2
Hand Speed (avg)
69.4
Bat Speed (max)
65.8
Bat Speed (avg)
Rot. Acc (max)
Rot. Acc (avg)
On Plane Eff (avg)
Pitching

2021
2020
Fastball
Velocity Max
The maximum observed fastball velocity in the given event year. Measured in miles per hour (MPH).
85.8
Fastball
Velocity Avg
The average velocity for all pitches of this type in the given event year. Measured in miles per hour (MPH).
84.8
Fastball
Spin Rate Avg
The average rate of spin for all pitches of this type in the given event year. Measured in rotations per minute (RPM).
2175
Fastball
Spin Score Avg
The average Bauer Units value of all fastballs in the given event year. Bauer Units are calculated for each pitch by dividing Spin Rate by Velocity.
25.6
Fastball
Total Movement Avg
The average total non-gravity movement for all pitches of this type in the given event year. Measured in inches (in).
Curveball
Velocity Avg
The average velocity for all pitches of this type in the given event year. Measured in miles per hour (MPH).
72.5
Curveball
Spin Rate Avg
The average rate of spin for all pitches of this type in the given event year. Measured in rotations per minute (RPM).
2092
Curveball
Total Movement Avg
The average total non-gravity movement for all pitches of this type in the given event year. Measured in inches (in).
Changeup
Velocity Avg
The average velocity for all pitches of this type in the given event year. Measured in miles per hour (MPH).
77.9
Changeup
Spin Rate Avg
The average rate of spin for all pitches of this type in the given event year. Measured in rotations per minute (RPM).
1822
Changeup
Total Movement Avg
The average total non-gravity movement for all pitches of this type in the given event year. Measured in inches (in).
Fastball
Velocity Max
The maximum observed fastball velocity in the given event year. Measured in miles per hour (MPH).
77.3
Fastball
Velocity Avg
The average velocity for all pitches of this type in the given event year. Measured in miles per hour (MPH).
76.2
Fastball
Spin Rate Avg
The average rate of spin for all pitches of this type in the given event year. Measured in rotations per minute (RPM).
1881
Fastball
Spin Score Avg
The average Bauer Units value of all fastballs in the given event year. Bauer Units are calculated for each pitch by dividing Spin Rate by Velocity.
24.7
Fastball
Total Movement Avg
The average total non-gravity movement for all pitches of this type in the given event year. Measured in inches (in).
Changeup
Velocity Avg
The average velocity for all pitches of this type in the given event year. Measured in miles per hour (MPH).
69.9
Changeup
Spin Rate Avg
The average rate of spin for all pitches of this type in the given event year. Measured in rotations per minute (RPM).
1442
Changeup
Total Movement Avg
The average total non-gravity movement for all pitches of this type in the given event year. Measured in inches (in).
Slider
Velocity Avg
The average velocity for all pitches of this type in the given event year. Measured in miles per hour (MPH).
69.9
Slider
Spin Rate Avg
The average rate of spin for all pitches of this type in the given event year. Measured in rotations per minute (RPM).
1954
Slider
Total Movement Avg
The average total non-gravity movement for all pitches of this type in the given event year. Measured in inches (in).
Upperclass Fall Showcase
Oct 9, 2021
Trackman - Fastball
85.8
Velocity (max)
84.2 - 85.5
Velo Range
84.1
Eff Velocity (avg)
2,253
Spin Rate (max)
2,175
Spin Rate (avg)
IVB (max)
IVB (avg)
HM (max)
HM (avg)
Extension (avg)
Release Ht (avg)
Spin Score (max)
Zone %
Trackman - Curveball
73.9
Velocity (max)
71.2 - 73.7
Velo Range
71.2
Eff Velocity (avg)
2,188
Spin Rate (max)
2,092
Spin Rate (avg)
IVB (max)
IVB (avg)
HM (max)
HM (avg)
Extension (avg)
Release Ht (avg)
Spin Score (max)
Zone %
Trackman - ChangeUp
78.5
Velocity (max)
77.4 - 78.5
Velo Range
77.4
Eff Velocity (avg)
1,905
Spin Rate (max)
1,822
Spin Rate (avg)
IVB (max)
IVB (avg)
HM (max)
HM (avg)
Extension (avg)
Release Ht (avg)
Spin Score (max)
Zone %
Washington Summer Kickoff
Jul 8, 2020
Trackman - Fastball
77.3
Velocity (max)
75.5 - 76.9
Velo Range
76.0
Eff Velocity (avg)
2,040
Spin Rate (max)
1,881
Spin Rate (avg)
IVB (max)
IVB (avg)
HM (max)
HM (avg)
Extension (avg)
Release Ht (avg)
Spin Score (max)
Zone %
Trackman - Slider
71.1
Velocity (max)
68.3 - 71.1
Velo Range
69.0
Eff Velocity (avg)
2,070
Spin Rate (max)
1,954
Spin Rate (avg)
IVB (max)
IVB (avg)
HM (max)
HM (avg)
Extension (avg)
Release Ht (avg)
Spin Score (max)
Trackman - ChangeUp
70.7
Velocity (max)
69.5 - 70.6
Velo Range
69.8
Eff Velocity (avg)
1,469
Spin Rate (max)
1,442
Spin Rate (avg)
IVB (max)
IVB (avg)
HM (max)
HM (avg)
Extension (avg)
Release Ht (avg)
Spin Score (max)
Zone %
Pitch Scores
2021
Fastball
Hop+
A fastball with hop has a flat approach angle and visually jumps through the zone. When thrown up in the zone, it is more likely to generate a higher swing and miss average. Hop+ of 100 is MLB average.
Fastball
Sink+
A fastball with sink has low backspin and drops through the strike zone. When thrown down in the zone, it is more likely to generate a higher ground ball percentage and lower launch angle. Sink+ of 100 is MLB average.
Fastball
Rise+
A fastball with rise has a high percentage of backspin. When thrown up in the zone, it is more likely to generate a higher fly ball percentage. Rise+ of 100 is MLB average
Pitching Velos
2023
2021
2020
2019
Fastball
Velocity Max
The maximum observed fastball velocity in the given event year. Measured in miles per hour (MPH).
93.0
Fastball
Velocity Avg
The average velocity for all pitches of this type in the given event year. Measured in miles per hour (MPH)
90.0
Slider
Velocity Avg
The average velocity for all pitches of this type in the given event year. Measured in miles per hour (MPH)
74.0
Fastball
Velocity Max
The maximum observed fastball velocity in the given event year. Measured in miles per hour (MPH).
86.0
Fastball
Velocity Avg
The average velocity for all pitches of this type in the given event year. Measured in miles per hour (MPH)
84.5
Curveball
Velocity Avg
The average velocity for all pitches of this type in the given event year. Measured in miles per hour (MPH)
71.5
Fastball
Velocity Max
The maximum observed fastball velocity in the given event year. Measured in miles per hour (MPH).
77.0
Fastball
Velocity Avg
The average velocity for all pitches of this type in the given event year. Measured in miles per hour (MPH)
75.2
Curveball
Velocity Avg
The average velocity for all pitches of this type in the given event year. Measured in miles per hour (MPH)
70.0
Changeup
Velocity Avg
The average velocity for all pitches of this type in the given event year. Measured in miles per hour (MPH)
70.0
Slider
Velocity Avg
The average velocity for all pitches of this type in the given event year. Measured in miles per hour (MPH)
70.5
Fastball
Velocity Max
The maximum observed fastball velocity in the given event year. Measured in miles per hour (MPH).
70.0
Fastball
Velocity Avg
The average velocity for all pitches of this type in the given event year. Measured in miles per hour (MPH)
68.5
Curveball
Velocity Avg
The average velocity for all pitches of this type in the given event year. Measured in miles per hour (MPH)
57.5
Game Performance

2023
10 Yard Dash
The athlete's fastest 0-10-yard split time in the given event year. Measured in seconds.
1.72
30 Yard Dash
The athlete's fastest 0-30-yard split time in the given event year. Measured in seconds.
3.92
60 Yard Dash
The athlete's fastest 0-60-yard time in the given event year. Measured in seconds.
7.02
Top Speed (MPH)
The athlete's fastest split time converted to miles per hour.
Visual Edge

2023
Edge Score
The highest Edge Score within the given year. Edge Score is a comprehensive score that takes the core-six visual skills into account, providing an assessment of an athlete’s overall visual ability.
61.13
Pitch Ai

Notes
News
- Shooter's Standouts: USA Trials (Position Players/2-Ways) - Jul 22, 2024
- 18U Trials: Day 1 - Jul 18, 2024
- '25 Rankings Update: The Case for Number 1 - May 23, 2024
- WA Power 25 Weekly Round Up (4.22.24 - 4.26.24) - Apr 26, 2024
- WA Power 25 Weekly Round Up (4.19.24 - 4.20.24) - Apr 22, 2024
- WA Power 25 Weekly Round Up (4.12.24 - 4.18.24) - Apr 12, 2024
- WA Power 25 Weekly Round Up (4.5.24 - 4.11.24) - Apr 12, 2024
- WA Power 25 Weekly Round Up (3.29.24 - 4.4.24) - Apr 4, 2024
- WA Power 25 Weekly Round Up (3.25.24 - 3.28.24) - Mar 29, 2024
- WA Power 25 Weekly Round Up (3.18.24 - 3.23.24) - Mar 24, 2024
- WA Power 25 Weekend Round Up (3.16.24) - Mar 19, 2024
- PNW Summer Opens Positional Data Dive - Aug 21, 2023
- 2025 Overall Rankings Updated & Expanded - Sep 2, 2022
- Area Code Underclass: Athletics - Aug 23, 2022
- WA/OR Best of 2021: Statistical Standouts In The 2025 Class - Jan 19, 2022
- Top-10 Profiles of 2021: No. 2, Xavier Neyens - Dec 30, 2021
- Initial 2025 Overall Rankings Release - Dec 3, 2021
- Introduction To The Class Of 2025 - Dec 1, 2021
- Junior Future Games - Stats Release & Game Recap - Aug 2, 2020
Comments
Draft Reports
Contact
Premium Content Area
To unlock contact information, you need to purchase a ScoutPLUS subscription.
Purchase Subscription OR
Login
Physical
2024
Grip Strgth (LH)
Grip strength is a measure of a players bat control and ability to transfer power and speed during impact, measured in pounds of force generated; collected with elbow bent at 90 degrees.
Grip Strgth (RH)
Grip strength is a measure of a players bat control and ability to transfer power and speed during impact, measured in pounds of force generated; collected with elbow bent at 90 degrees.









 Sign in to view rankings
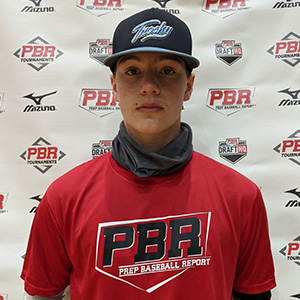
OF/RHP Xavier Neyens’ (Mount Vernon HS, WA) rise inside this update is the biggest movement within this top-10. It’s easy to dream of his future as either a big left-handed stick or power arm because Neyens presents multiple carrying tools already, and he should have a strong chance of elevating his two-way skill set to new heights in the coming years. His present ability to stand out among fellow elite peers only adds to his allure and upside. The Oregon State recruit moves up to No. 7 in the class overall.
Neyens, an Oregon State recruit, built a strong case for being the top prospect in the 2025 class thanks to the elite impact tools that he displayed at the event. Standing out in uniform amongst his teammates with a 6-foot-2, 190-pound frame that oozes athleticism and upside, the left-handed hitting slugger put on a show in batting practice, showcasing the biggest raw power on the roster. The hands load deeper into a low arm bar before delivering electric bat speed with length through the zone. A home run to the deepest part of the park at an hour when no balls were leaving the yard garnered some murmurs from the onlooking scouts, and Neyens carried those aggressive, yet balanced, swings over to game play though he rarely saw a strike in his plate appearances. Adding to elite prospect status, the right-hander hopped on the mound and ran his fastball up to 94 mph with even more velocity likely on the way. There is feel for a breaking ball that could tick up in coming years, but the raw stuff gives him a chance to be special. The upside on both sides of the ball is immense, and Neyens will likely have scouts split on where his future ultimately takes him. Either way, that future is promising.
Perhaps the prospect with the loudest array of tools, that equate to large statistical outputs, on this list is INF/RHP Xavier Neyens (Mount Vernon; WA). The 6-foot-2, 180-pound Oregon State commit has an incredibly physical skill-set, one that has him penciled inside the top-15 prospects in the entire country for the 2025 class. Neyens posted a 98.1 mph max exit velocity with a 378 ft. peak batted distance at an October event this year, following it up with an 86 mph strike across the infield during his defensive evaluation. He hopped on the mound later that same day and ran his fastball up to 86 mph, too. We’re eager to see the physical and statistical improvements Neyens can make over the course of his prep career.