23.6
Hand Speed (max)
8/11/23
Rankings available to Premium Subscriber
Rankings available to Premium Subscriber


To unlock contact information, you need to purchase a ScoutPLUS subscription.
Purchase Subscription
 Sign in to view rankings
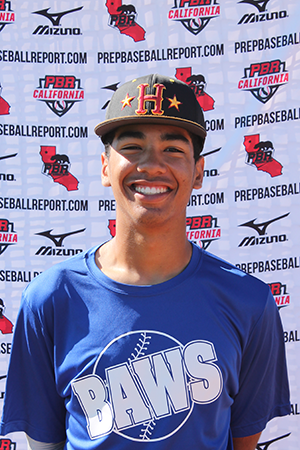
Positional Profile: SS/2B Shaw is an extremely versatile player, he can plug in anywhere on the field while hitting from both sides of the plate.
Body: 6-3, 197-pounds. Tall athletic build. Put together physique
Hit: SH. Tall open stance, hands are up by his ear. Same stance from both sides of the plate. Small stride with a smaller load. Consistent line drives to all fields. 61.2 mph bat speed with 18 G’s of rotational acceleration.
Power: 89 max exit velocity, averaged 80.7 mph. 290' max distance.
Arm: RH. INF-74 mph. Comfortable throwing from all angles. Good accuracy.
Defense: Wide range, athletic on his feet. Good hands to throw mechanics.
ATH: 7.12 runner in the 60. 1.69 and 3.95 in the 10 and 30 yard splits.
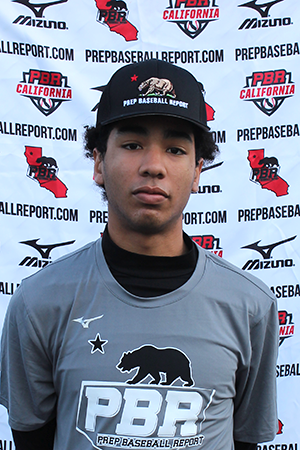
Positional Profile: SS/2B
Body: 6-3/182. Tall, lanky build with athletic instincts. RSi- 1.79 10yd - 1.73, 60yd - 7.13, VERT - 26.9
Arm: INF - 80mph. RH. Short arm swing out of a ¾ slot. 5 out of 5 throws made accurately, ball has plenty of life across the diamond. Accurate thrower from a low slot with momentum shifting up the middle/towards the plate.
Defense: Prep step, smooth/athletic feet to the ball, gets around the ball well, funnels cleanly to chest into a quick exchange, smooth/fluid release with longer extension through throws. Keeps an open hip towards target. Athleticism is present both with the glove and arm. Confident, sure hands and looks to be a very reliable defender.
Hit: Switch Hitter. Upright, open, narrow base. Medium knee lift trigger while hands cock the barrel forward, small stride. Hands begin high by the head, barrel works down on the ball and up through extension. Can unlock power through more use of the lower half. Quick hands (Hand speed max- 23.4mph) and gets the bat head out front. Bat path slightly inconsistent every few swings. Looks to have more barrel control through the zone from the right side, but a whippier swing from the left. Projectable player both offensively and defensively.
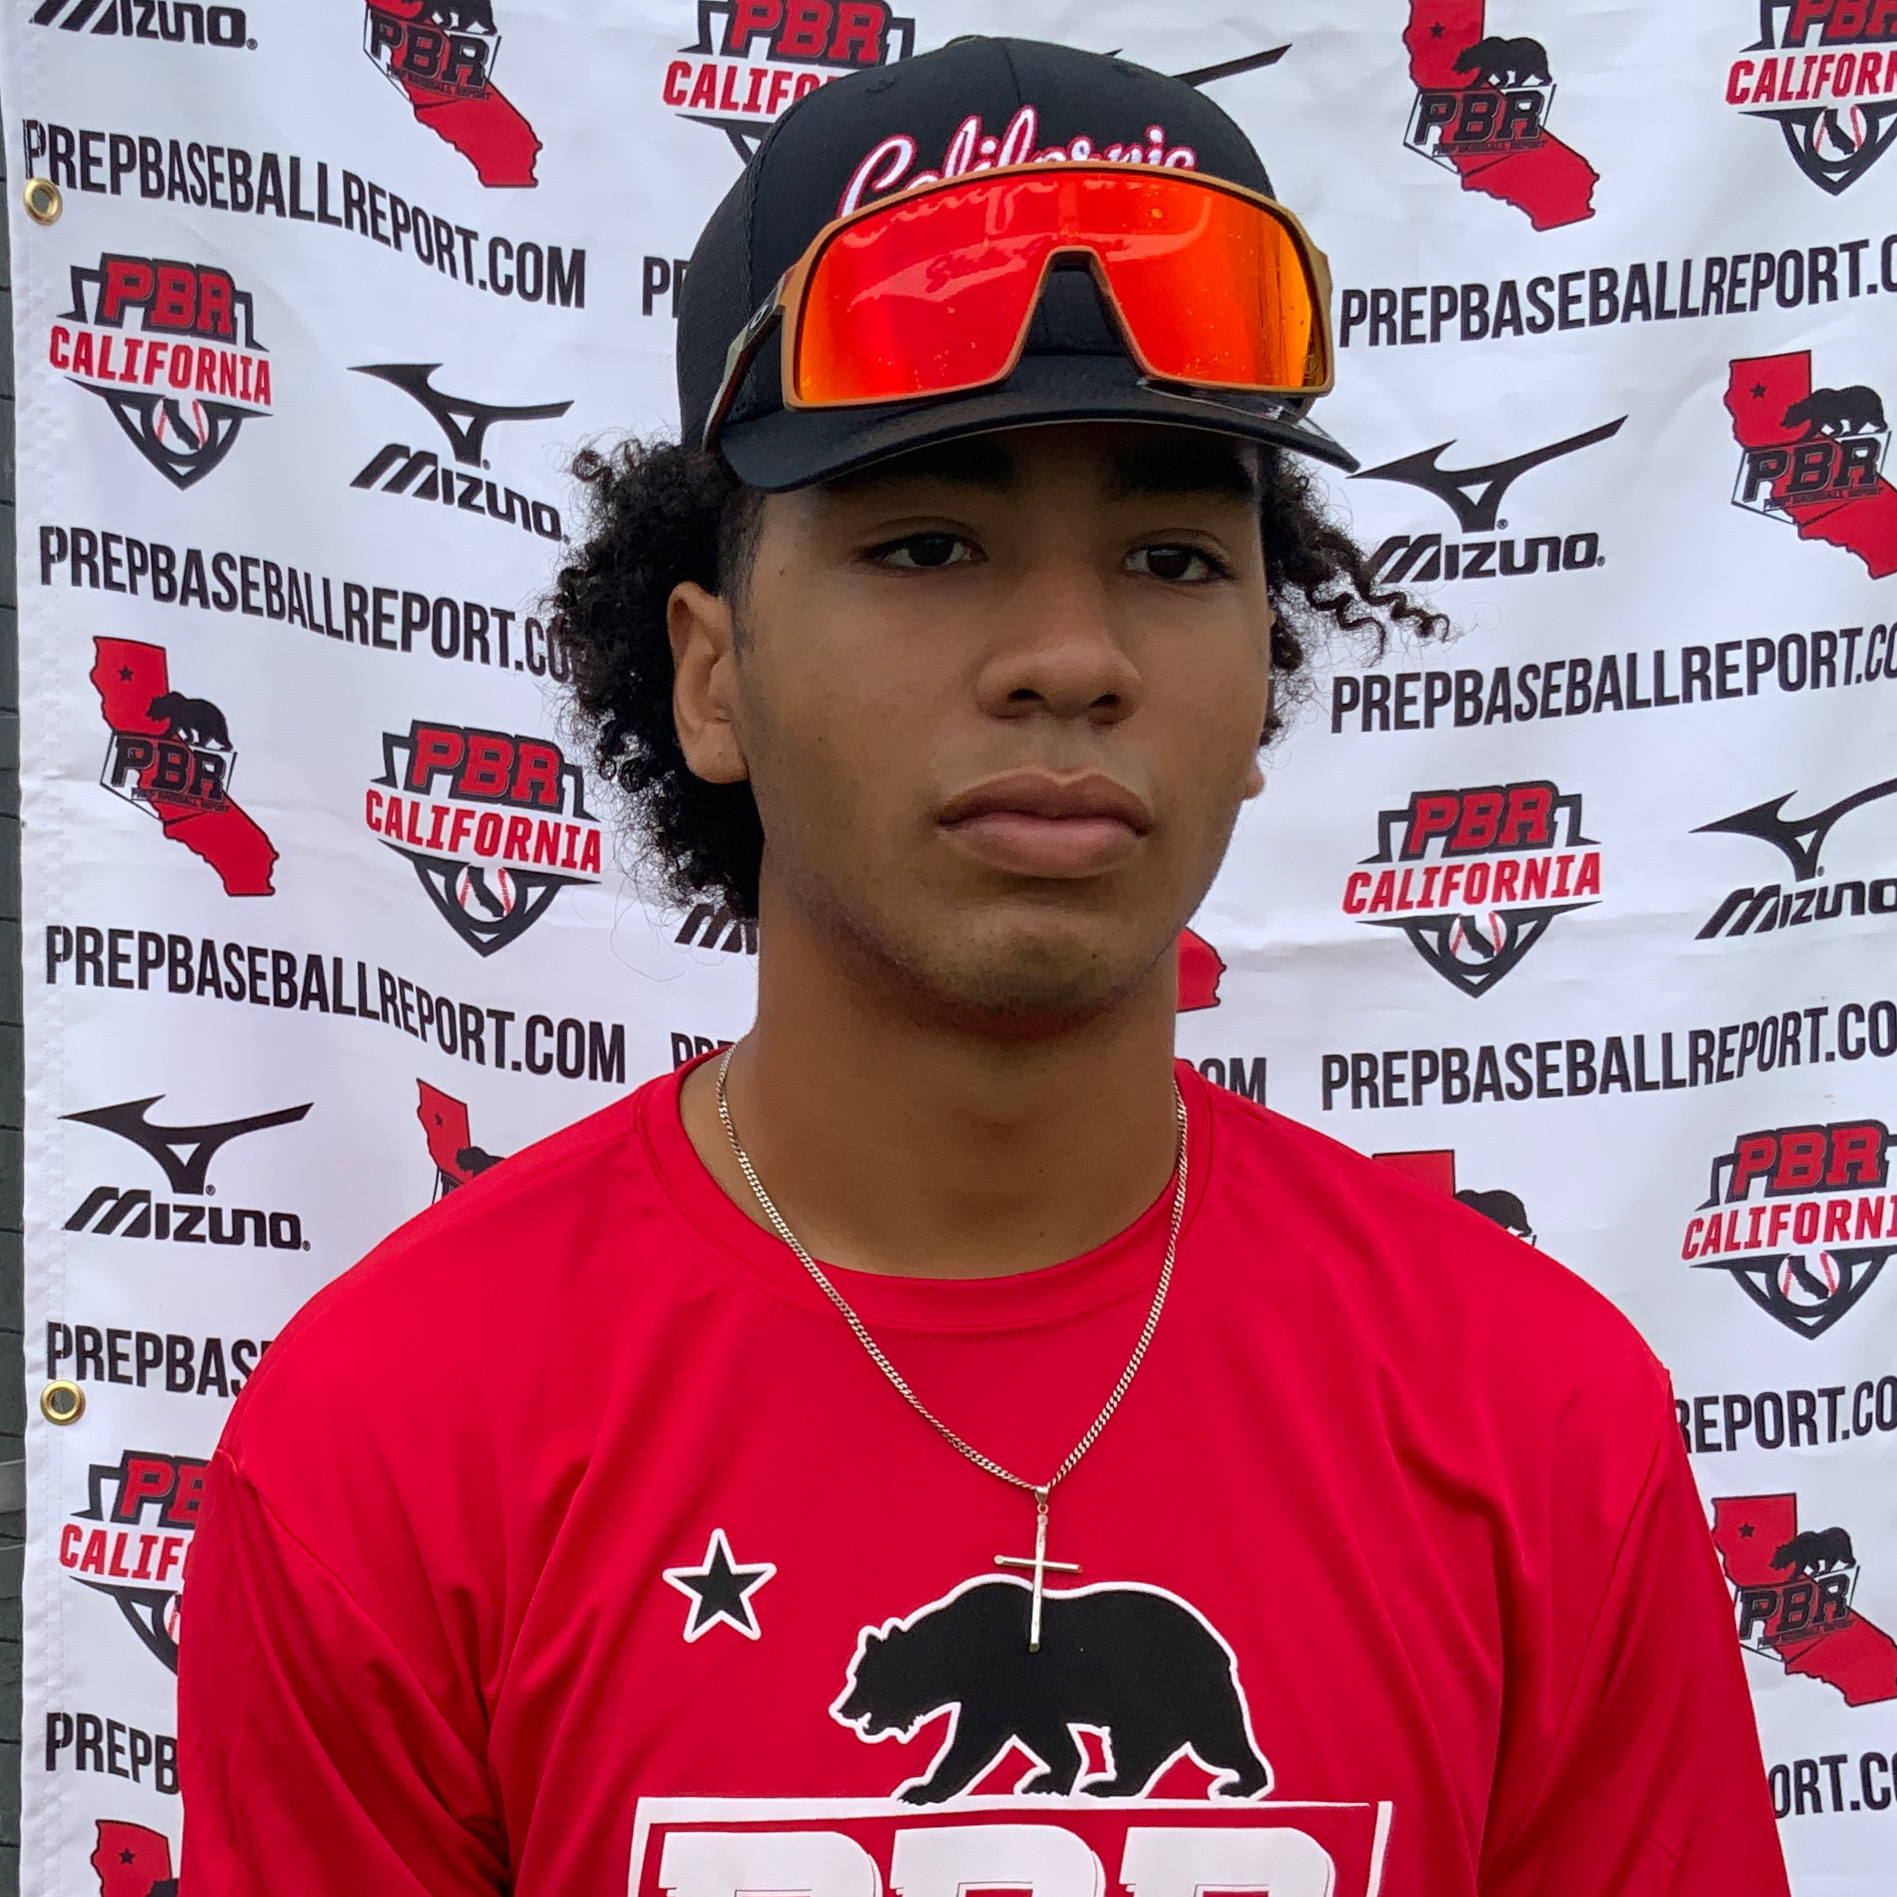
Bay Area World Series 2022 - Uncommitted; Long and lean with an athletic body type that immediately draws eyes when arriving to a field, runs easily while posting a 7.13 60-yd, raw arm flashes and maxed at 78 mph so that is something that will have to continue to improve with physical maturity, fluid fielder with graceful actions and movements, plays well on the move, accurate thrower, switch-hitter with some ability to put pressure on D with underway speed, can improve consistency of contact on both sides of plate, max EV 93 mph, 46% sweet spot %, 31% line drives and 38.5% fly balls, certainly has some traits to keep him on the radar among 2024 athletes who play on the dirt.
Positional Profile: SS/2B
Physical: 6-2, 175-pounds; Long, lean build. 7.36 runner in the 60.
Offensively: Switch hitter. Open setup, with feet shoulder width apart; upright bat position. Short take back with the hands with a moderate leg kick for timing. Drifts into contact while showing an aggressive lower half. Showed a slight lift to the ball with a high finish. More line drives than fly balls and ground balls with a peak exit velocity of 88 MPH via Trackman. Swing description fits both sides of the plate, has whippy life in swings, more bat control on the RH side, routinely found barrel, strength gains will bring along the potential power.
Defensively: Starts with a balanced setup; uses prep hop while playing low to the ground. Hands are out in front while funneling to the hip before transfer. Moderate arm circle from a high/over the top arm slot. INF - 75 MPH. Long stride range, keeps head up and level, accurate thrower, strong body control, confident defender.
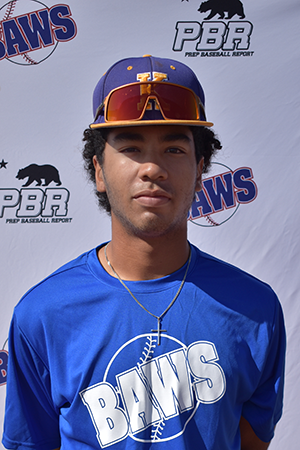
Positional Profile: SS/2B
Body: 6-2, 185-pounds. Long athletic body, has lean strength now with room for development of muscle and physicality.
Hit: SH. RHH - Medium depth in box, open, pinched knees, lower hands with elbows flared opposite each other, high knee lift out to long stride, small quiet load of hands. LHH - Similar set as RH side, knees pinched, medium depth in box, wide open with medium width feet, lower hands than on RH side, smooth lift to pinched knees out to medium stride. RHH - Short to ball, accelerates aggressively through contact with some violence in a loose stroke, flashed barrel control and life. LHH - Throws top hand through contact, front foot has some release of energy, show more bat control on LH side with more aggressive move upward through contact toward aggressive attack angle, has power in his future.
Power: 87 max exit velocity, 68.3 max bat speed, 23.4 max hand speed.
Arm: RH. INF - 72 mph. Overhand release, arm plays up when closes ground on ball, throws stayed on-line, arm stroke fairly compact with smooth action.
Defense: Soft hands, comfortable playing on move and using athleticism, has quality range with long body and his footspeed, release time can speed up.
Run: 7.14 runner in the 60.
Bay Area World Series Underclass (6/4/21-6/6/21)
Offensive notes: RH: Slight open stance with hands pulling back on slight crunch. Quick hands able to drive the backside and lets hands do the work driving balls through the pull-side gap.
LH: Similar stance with less movements and more usage of the hands in the swing. The quick bat is still there a bit more direct than RH. In game was regular on pitches and worked deep counts. Wasn't willing to chase outside the zone. Constantly ran out to be a runner in pinch-runner situations on all three days, displayed big time joy for the game. 60-yard - 7.24 / EV mph - 87
Defensive notes: Strong prep and ability to bounce off landing for first step actions. Utilizes his length well with strong footwork and ablitity to control the frame and funnel to the middle. Arm was accurate and played up in games with a quicker release. Made plays with good range in games and can fit at MIF for long term. INF mph - 73