CLASS OF 2024
C
OF
Coy
Clements
Southern Miss
Oak Grove (HS) • MS
6' 3" • 205LBS
R/R • 19yr 4mo
Travel Team: Indiana Prospects
Oak Grove (HS) • MS
6' 3" • 205LBS
R/R • 19yr 4mo
Travel Team: Indiana Prospects
Rankings
2024 National
Rankings available to Premium Subscriber
2024 State
Rankings available to Premium Subscriber
Commitment
Best Of Stats
23.8
Hand Speed (max)
6/01/22
82.3
Bat Speed (max)
7/27/22
17
Rot. Acc (max)
6/01/22
55
Hard Hit %
1/21/23
95.7
Exit Velocity (max)
1/21/23
90
Exit Velocity (avg)
1/21/23
354
Distance (max)
1/21/23
64
Sweet Spot %
1/21/23
7.57
60
6/01/22
4.04
30-yd
1/21/23
1.77
10-yd
1/21/23
18
Run speed (max)
1/21/23
57
INF Velo
11/11/18
-
OF Velo
81
C Velo
7/27/22
1.92 - 2.08
Pop Time
6/01/22
Positional Tools
2023
2022
2019
2018
Pop Time
The athlete's fastest pop time in the given event year. Measured from glove to glove, in seconds (s).
2.03 - 2.12
Catcher Velocity
The athlete's maximum throwing velocity from the catcher position in the given event year. Measured in miles per hour (MPH).
75.0
60 Yard Dash
The athlete's fastest 60-yard dash time in the given event year. Measured in seconds (s)
7.57
Pop Time
The athlete's fastest pop time in the given event year. Measured from glove to glove, in seconds (s).
1.92 - 2.08
Catcher Velocity
The athlete's maximum throwing velocity from the catcher position in the given event year. Measured in miles per hour (MPH).
81.0
Power / Speed Score
A simple calculation that divides the athlete’s Exit Velocity Max by the athlete’s 60 Yard Dash time for the given event year. For example, 98 MPH / 7.00s = 14.00.
11.8
60 Yard Dash
The athlete's fastest 60-yard dash time in the given event year. Measured in seconds (s)
9.12
Pop Time
The athlete's fastest pop time in the given event year. Measured from glove to glove, in seconds (s).
2.69 - 2.79
Catcher Velocity
The athlete's maximum throwing velocity from the catcher position in the given event year. Measured in miles per hour (MPH).
57.0
Infield Velocity
The athlete's maximum throwing velocity from an infield position in the given event year. Measured in miles per hour (MPH).
56.0
Power / Speed Score
A simple calculation that divides the athlete’s Exit Velocity Max by the athlete’s 60 Yard Dash time for the given event year. For example, 98 MPH / 7.00s = 14.00.
7.0
Pop Time
The athlete's fastest pop time in the given event year. Measured from glove to glove, in seconds (s).
2.55 - 2.62
Catcher Velocity
The athlete's maximum throwing velocity from the catcher position in the given event year. Measured in miles per hour (MPH).
56.0
Infield Velocity
The athlete's maximum throwing velocity from an infield position in the given event year. Measured in miles per hour (MPH).
57.0
Hitting

2023
2022
Exit Velocity Max
The highest exit velocity of any batted ball in the given event year. Measured in miles per hour (MPH).
95.7
Exit Velocity Avg
Average exit velocity of all batted balls in the given event year. Measured in miles per hour (MPH).
90.0
Distance Max
The highest flight distance of any batted ball in the given event year. Measured in feet (ft).
354
Distance Avg
Average flight distance of all batted balls in the given event year. Measured in feet (ft).
298
Launch Angle Avg
Average launch angle of all batted balls in the given event year. Measured in degrees.
25.2
Hard Hit %
Percentage of batted balls with exit velocities over 95 MPH in the given event year.
Sweet Spot %
Percentage of batted balls in the given event year with a launch angle between 8° and 32°.
Line Drive %
Percentage of batted balls with launch angles between 10 and 25 degrees in the given event year.
Fly Ball %
Percentage of batted balls with launch angles between 25 and 50 degrees in the given event year.
Ground Ball %
Percentage of batted balls with launch angles below 10 degrees in the given event year.
Exit Velocity Max
The highest exit velocity of any batted ball in the given event year. Measured in miles per hour (MPH).
89.5
Exit Velocity Avg
Average exit velocity of all batted balls in the given event year. Measured in miles per hour (MPH).
81.4
Distance Max
The highest flight distance of any batted ball in the given event year. Measured in feet (ft).
329
Distance Avg
Average flight distance of all batted balls in the given event year. Measured in feet (ft).
210
Launch Angle Avg
Average launch angle of all batted balls in the given event year. Measured in degrees.
21.5
Hard Hit %
Percentage of batted balls with exit velocities over 95 MPH in the given event year.
Sweet Spot %
Percentage of batted balls in the given event year with a launch angle between 8° and 32°.
Line Drive %
Percentage of batted balls with launch angles between 10 and 25 degrees in the given event year.
Fly Ball %
Percentage of batted balls with launch angles between 25 and 50 degrees in the given event year.
Ground Ball %
Percentage of batted balls with launch angles below 10 degrees in the given event year.
Preseason All-State (Invite-Only)
Jan 21, 2023
Trackman - Hitting
95.7
Exit Velocity (max)
90.0
Exit Velocity (avg)
298
Distance (avg)
354
Distance (max)
Hard Hit %
Sweet Spot %
Line Drive %
Fly Ball %
Ground Ball %
2022 PBR Future Games
Jul 27, 2022
Trackman - Hitting
94.6
Exit Velocity (max)
84.7
Exit Velocity (avg)
259
Distance (avg)
330
Distance (max)
Hard Hit %
Sweet Spot %
Line Drive %
Fly Ball %
Ground Ball %
2022 PBR Idaho State Games
Jun 1, 2022
Trackman - Hitting
89.5
Exit Velocity (max)
83.7
Exit Velocity (avg)
225
Distance (avg)
329
Distance (max)
Sweet Spot %
Line Drive %
Fly Ball %
Ground Ball %
Indiana Prospects Scout Day
Jan 8, 2022
Trackman - Hitting
83.8
Exit Velocity (max)
73.6
Exit Velocity (avg)
162
Distance (avg)
211
Distance (max)
Sweet Spot %
Line Drive %
Fly Ball %
Ground Ball %
Hitting

2023
2022
Hand Speed Max
The highest Peak Hand Speed of any swing in the given event year.
23.7
Hand Speed Avg
The average Peak Hand Speed for all swings in the given event year.
22.0
Bat Speed Max
The highest Bat Speed of any swing in the given event year.
75.0
Bat Speed Avg
The average Bat Speed for all swings in the given event year.
68.9
Rotational Acceleration Max
The highest Rotational Acceleration of any swing in the given event year.
Rotational Acceleration Avg
The average Rotational Acceleration for all swings in the given event year.
On-Plane Efficiency Max
The highest On-Plane Efficiency of any swing in the given event year.
On-Plane Efficiency Avg
The average On-Plane Efficiency for all swings in the given event year.
Hand Speed Max
The highest Peak Hand Speed of any swing in the given event year.
23.8
Hand Speed Avg
The average Peak Hand Speed for all swings in the given event year.
20.7
Bat Speed Max
The highest Bat Speed of any swing in the given event year.
82.3
Bat Speed Avg
The average Bat Speed for all swings in the given event year.
69.0
Rotational Acceleration Max
The highest Rotational Acceleration of any swing in the given event year.
Rotational Acceleration Avg
The average Rotational Acceleration for all swings in the given event year.
On-Plane Efficiency Max
The highest On-Plane Efficiency of any swing in the given event year.
On-Plane Efficiency Avg
The average On-Plane Efficiency for all swings in the given event year.
Preseason All-State (Invite-Only)
Jan 21, 2023
Blast - Hitting
23.7
Hand Speed (max)
22.0
Hand Speed (avg)
75.0
Bat Speed (max)
68.9
Bat Speed (avg)
Rot. Acc (max)
Rot. Acc (avg)
On Plane Eff (avg)
MaxOnPlaneEfficiency
2022 PBR Future Games
Jul 27, 2022
Blast - Hitting
21.9
Hand Speed (max)
20.8
Hand Speed (avg)
82.3
Bat Speed (max)
73.3
Bat Speed (avg)
Rot. Acc (max)
Rot. Acc (avg)
On Plane Eff (avg)
MaxOnPlaneEfficiency
2022 PBR Idaho State Games
Jun 1, 2022
Blast - Hitting
23.8
Hand Speed (max)
22.3
Hand Speed (avg)
73.3
Bat Speed (max)
70.4
Bat Speed (avg)
Rot. Acc (max)
Rot. Acc (avg)
On Plane Eff (avg)
MaxOnPlaneEfficiency
Indiana Prospects Scout Day
Jan 8, 2022
Blast - Hitting
19.7
Hand Speed (max)
18.5
Hand Speed (avg)
64.8
Bat Speed (max)
62.4
Bat Speed (avg)
Rot. Acc (max)
Rot. Acc (avg)
On Plane Eff (avg)
MaxOnPlaneEfficiency
Pitching

Pitch Scores
Pitching Velos
Game Performance

2023
10 Yard Dash
The athlete's fastest 0-10-yard split time in the given event year. Measured in seconds.
1.77
30 Yard Dash
The athlete's fastest 0-30-yard split time in the given event year. Measured in seconds.
4.04
Top Speed (MPH)
The athlete's fastest split time converted to miles per hour.
Preseason All-State (Invite-Only)
Jan 21, 2023
Swift
1.77
10-yd
4.04
30-yd
18.0
Run speed (max)
1.69
RSi (max)
1.69
RSi (avg)
1,558
Jump Power (max)
26.9
Jump Height (max)
26.9
Jump Height (avg)
2022 PBR Future Games
Jul 27, 2022
Swift
2.04
10-yd
4.37
30-yd
7.72
60-yd
18.3
Run speed (max)
7.8
Run Speed (avg)
1.44
RSi (max)
1.44
RSi (avg)
1,540
Jump Power (max)
26.6
Jump Height (max)
26.2
Jump Height (avg)
Visual Edge

Pitch Ai

Notes
News
- Mississippi Scout Blog: 2024 Playoffs - May 20, 2024
- Around the Horn: Week 3 - Mar 5, 2024
- Mississippi Diamond Notes: Week 2 - Feb 28, 2024
- Mississippi Scout Blog: Week 1 Games - Feb 18, 2024
- MS Diamond Notes: Week 3 - Mar 7, 2023
- Mississippi Preseason All-State: Quick Hits - Jan 22, 2023
- 2022 Future Games: Idaho Prospect Stats - Aug 1, 2022
- 2022 Future Games - Invite Accepted: Coy Clements (Team Select) - Jun 28, 2022
- PBR Idaho State Games: Quick Hits - Jun 5, 2022
Comments
Draft Reports
Contact
Premium Content Area
To unlock contact information, you need to purchase a ScoutPLUS subscription.
Purchase Subscription OR
Login


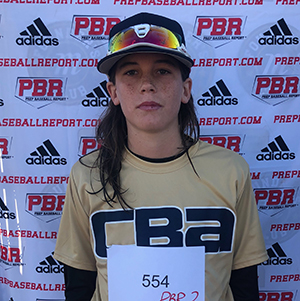






 Sign in to view rankings
Positional Profile: C/OF
Body: 6-2, 175-pounds. Long, leaner frame. Athletic with room to add size.
Hits: RHH. Balanced stance with very slight preset load. Normal hand set. Natural lift in the swing, easy pop to the middle and pull side. Consistent loud barrels, advanced approach.
Power: 96 max exit velocity, averaged 90 MPH. 354' max distance.
Arm: RH. C-75 mph. Loose, quick arm action
Defense: 2.03-2.12 pop times. Mature presence in set up with quick feet, and good direction. Body stays controlled on throws to 2nd. Advanced skill set on blocks and bunts and solid recovery on both. Will continue to get better.
Positional Profile: C
Body: 6-foot-2 , 175-pounds.
Hit: RHH. Wide based, open set up. Shifts back into low hovering, knee to knee load. Hands work well to the ball with some rotational features. Level through the zone. Consistent barrels t/o is BP Session. Lived in the big part of the yard. Significant power to come as he fills out his frame.
Power: Max TrackMan Exit Velocity - 89.5, Avg. TrackMan Exit Velocity - 84.0 mph.
Arm: RH. C - 75 mph.
Defense: 1.92 Pop Time. Athleticism shines through behind the plate. Present flexibility in his set up. Moves well during his catch/throw process.
Run: 7.57 runner in the 60.
Coy Clements, Whitney, 2024, ID
Position: C/OF
Body: 6-foot-1, 160-pound long projectable frame.
Hit: (RHH) Projectable. Starts in a wide stance with a smooth handsy load, then uses a controlled leg kick. Efficient bat speed. Front foot finish, flat swing. Line drive approach.
Power: 84 mph exit velocity, average 73.6 mph. 62.4 mph bat speed average. 18.5 mph hand speed average.
Defense: (C) 1.95-2.01 pop times. Sure hands, quick footwork. Capable. Athletic staggered setup with a lot of flexibility.
Arm: 75 mph catcher velocity. Quick arm action, high ¾ slot, decent accuracy.
Speed: 7.78 (60-yard).
CBA Sacramento tryout - One of younger players at the tryout and he's a good ballplayer, size and strength are obviously still down the road, displayed good baseball feel and actions in all that he did, looks comfortable on the field, starts with open stance, lower half works quite well in his swing, chance to be explosive lower body someday, defensively showed smooth hands in the infield and good receiving skills in the bullpen. Energetic player.