CLASS OF 2024
OF
RHP
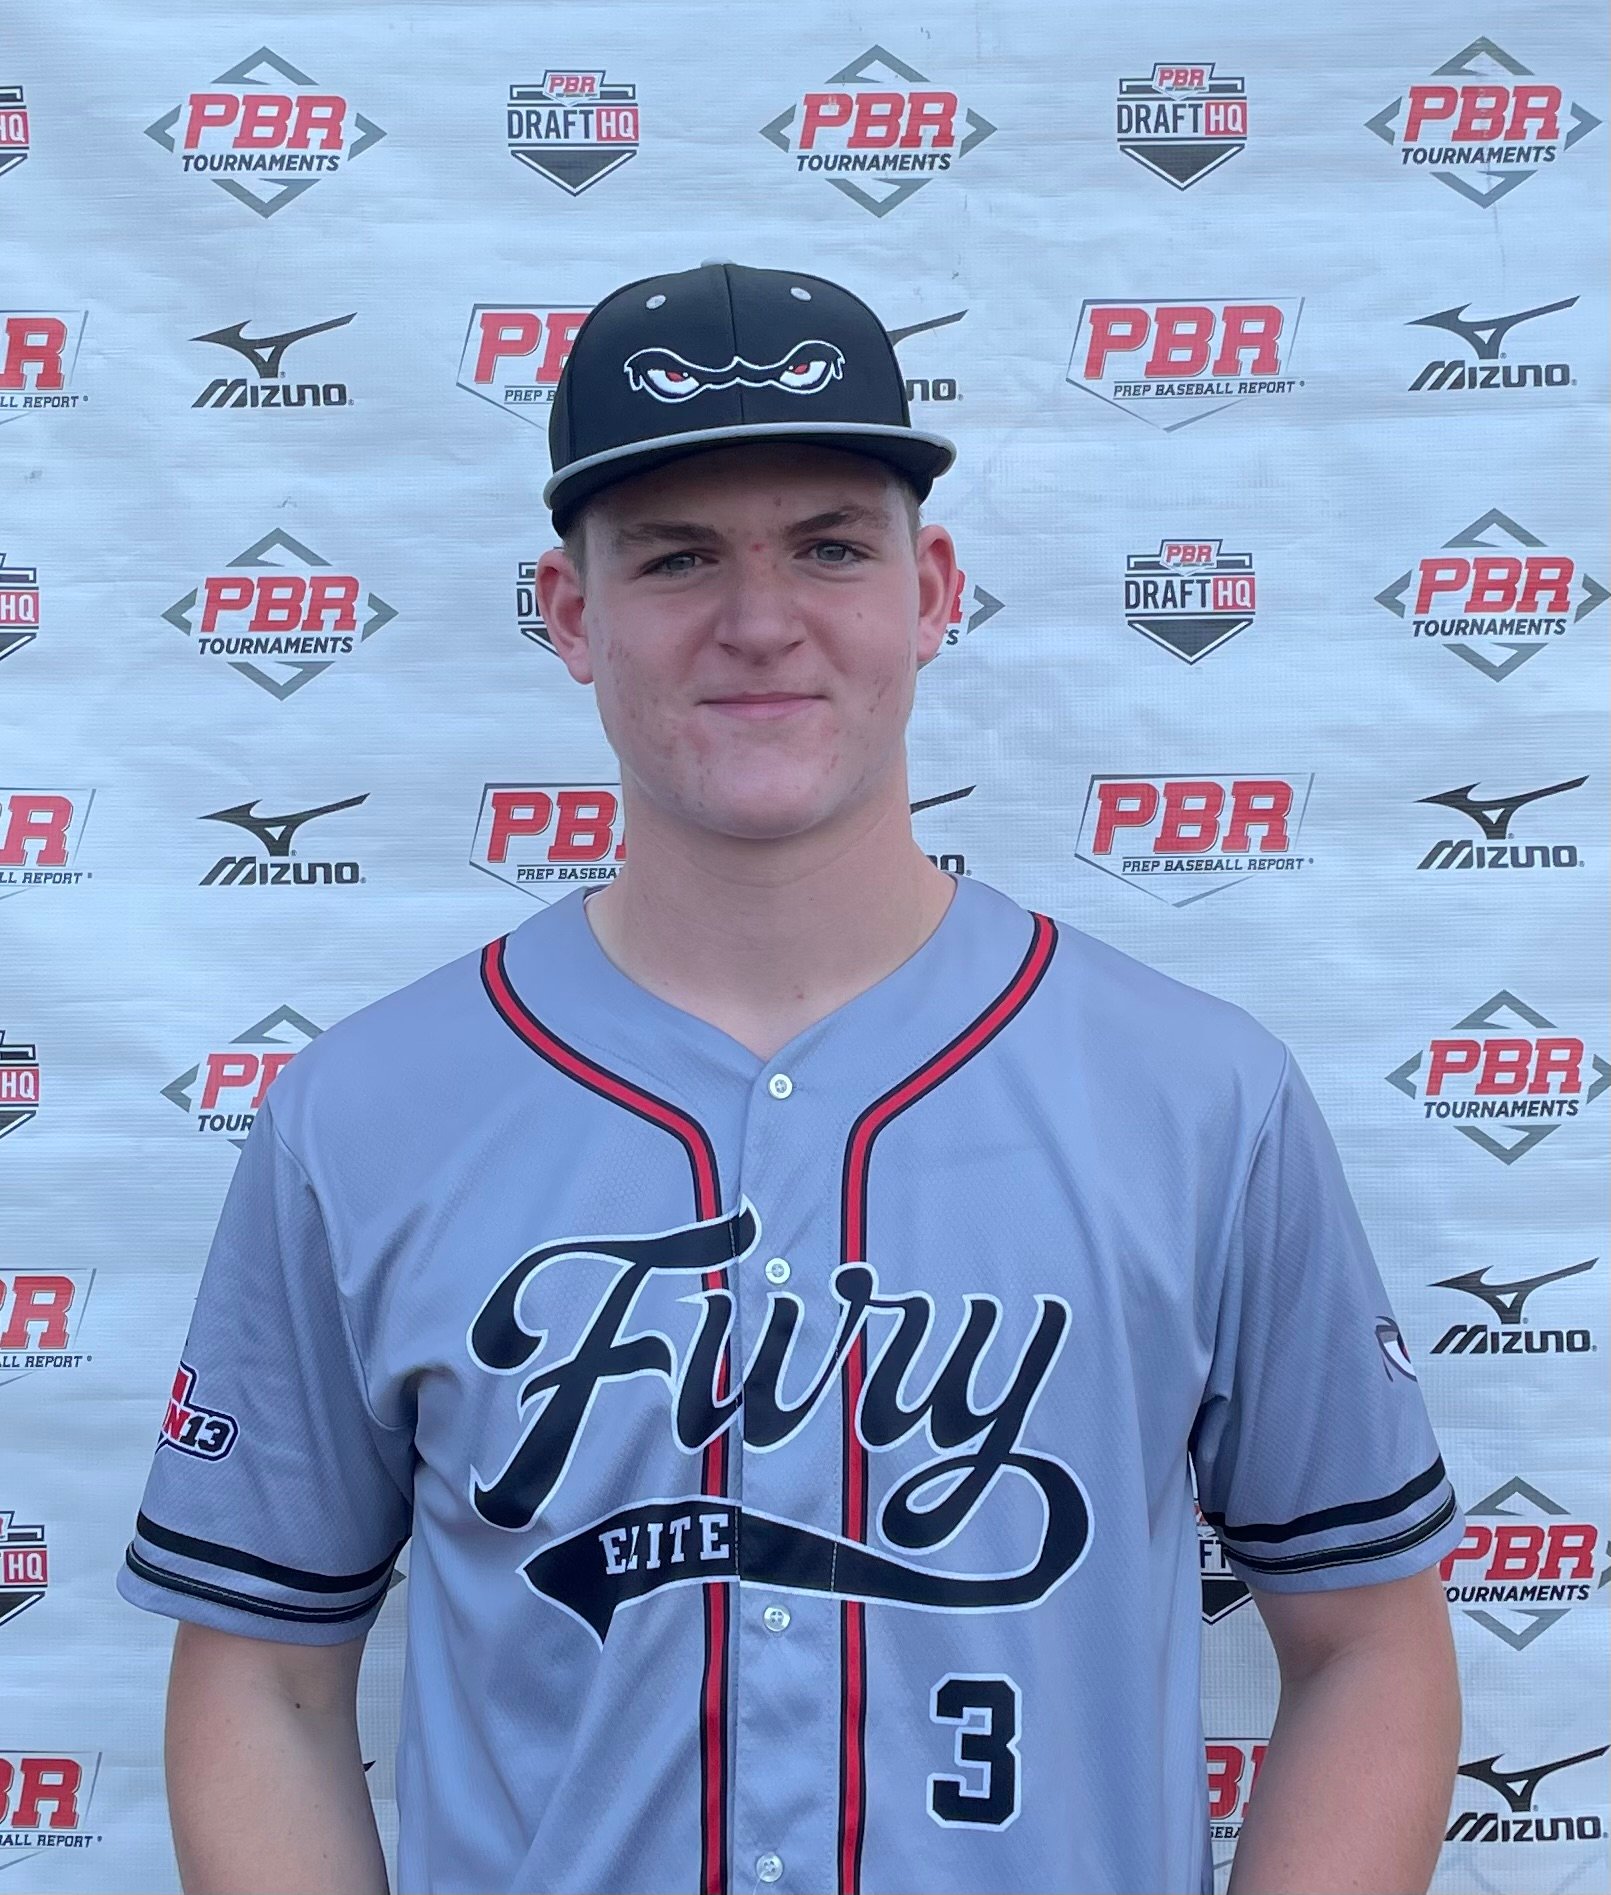
Tyler
DeBrocky
Canisius
Mahopac (HS) • NY
 6' 4" • 216.5LBS
R/R • 18yr 3mo
Travel Team: Game On 13 Fury Elite
Mahopac (HS) • NY
R/R • 18yr 3mo
Travel Team: Game On 13 Fury Elite
Rankings
2024 National
Rankings available to Premium Subscriber
2024 State
Rankings available to Premium Subscriber
Commitment
Best Of Stats
23.8
Hand Speed (max)
8/08/23
83.7
Bat Speed (max)
6/28/23
17.8
Rot. Acc (max)
6/28/23
50
Hard Hit %
6/28/23
97.3
Exit Velocity (max)
7/19/23
88.1
Exit Velocity (avg)
6/28/23
359
Distance (max)
7/19/23
70
Sweet Spot %
6/28/23
7.55
60
6/28/23
4.2
30-yd
6/28/23
1.75
10-yd
6/27/22
18.3
Run speed (max)
6/28/23
74
INF Velo
6/22/22
90
OF Velo
8/08/23
-
C Velo
-
Pop Time
Fastball
88
Velocity (max)
8/08/23
85 - 86.7
Velo Range
7/19/23
1975
Spin Rate (avg)
7/19/23
Changeup
71.6 - 73
Velo Range
7/19/23
1263
Spin Rate (avg)
7/19/23
Curveball
68.6 - 69.1
Velo Range
6/28/23
1554
Spin Rate (avg)
7/19/23
Positional Tools
2023
2022
60 Yard Dash
The athlete's fastest 60-yard dash time in the given event year. Measured in seconds (s)
7.84
Outfield Velocity
The athlete's maximum throwing velocity from an outfield position in the given event year. Measured in miles per hour (MPH).
90.0
Power / Speed Score
A simple calculation that divides the athlete’s Exit Velocity Max by the athlete’s 60 Yard Dash time for the given event year. For example, 98 MPH / 7.00s = 14.00.
12.4
Infield Velocity
The athlete's maximum throwing velocity from an infield position in the given event year. Measured in miles per hour (MPH).
74.0
Outfield Velocity
The athlete's maximum throwing velocity from an outfield position in the given event year. Measured in miles per hour (MPH).
79.0
Hitting

2023
2022
Exit Velocity Max
The highest exit velocity of any batted ball in the given event year. Measured in miles per hour (MPH).
97.3
Exit Velocity Avg
Average exit velocity of all batted balls in the given event year. Measured in miles per hour (MPH).
82.8
Distance Max
The highest flight distance of any batted ball in the given event year. Measured in feet (ft).
359
Distance Avg
Average flight distance of all batted balls in the given event year. Measured in feet (ft).
250
Launch Angle Avg
Average launch angle of all batted balls in the given event year. Measured in degrees.
26.7
Hard Hit %
Percentage of batted balls with exit velocities over 95 MPH in the given event year.
Sweet Spot %
Percentage of batted balls in the given event year with a launch angle between 8° and 32°.
Line Drive %
Percentage of batted balls with launch angles between 10 and 25 degrees in the given event year.
Fly Ball %
Percentage of batted balls with launch angles between 25 and 50 degrees in the given event year.
Ground Ball %
Percentage of batted balls with launch angles below 10 degrees in the given event year.
Exit Velocity Max
The highest exit velocity of any batted ball in the given event year. Measured in miles per hour (MPH).
90.5
Exit Velocity Avg
Average exit velocity of all batted balls in the given event year. Measured in miles per hour (MPH).
79.9
Distance Max
The highest flight distance of any batted ball in the given event year. Measured in feet (ft).
322
Distance Avg
Average flight distance of all batted balls in the given event year. Measured in feet (ft).
213
Launch Angle Avg
Average launch angle of all batted balls in the given event year. Measured in degrees.
23.0
Hard Hit %
Percentage of batted balls with exit velocities over 95 MPH in the given event year.
Sweet Spot %
Percentage of batted balls in the given event year with a launch angle between 8° and 32°.
Line Drive %
Percentage of batted balls with launch angles between 10 and 25 degrees in the given event year.
Fly Ball %
Percentage of batted balls with launch angles between 25 and 50 degrees in the given event year.
Ground Ball %
Percentage of batted balls with launch angles below 10 degrees in the given event year.
2023 Northeast Senior Games
Aug 8, 2023
Trackman - Hitting
89.9
Exit Velocity (max)
74.5
Exit Velocity (avg)
220
Distance (avg)
280
Distance (max)
Sweet Spot %
Line Drive %
Fly Ball %
Ground Ball %
2023 Game On Fury Scout Day
Jul 19, 2023
Trackman - Hitting
97.3
Exit Velocity (max)
85.7
Exit Velocity (avg)
253
Distance (avg)
359
Distance (max)
Hard Hit %
Sweet Spot %
Line Drive %
Fly Ball %
Ground Ball %
2023 NYS Games Session 2
Jun 28, 2023
Trackman - Hitting
95.9
Exit Velocity (max)
88.1
Exit Velocity (avg)
280
Distance (avg)
351
Distance (max)
Hard Hit %
Sweet Spot %
Line Drive %
Fly Ball %
Ground Ball %
2022 NYS Games (Session 1)
Jun 27, 2022
Trackman - Hitting
90.5
Exit Velocity (max)
84.0
Exit Velocity (avg)
202
Distance (avg)
322
Distance (max)
Hard Hit %
Sweet Spot %
Line Drive %
Ground Ball %
2022 Game On Fury Scout Day
Jun 22, 2022
Trackman - Hitting
88.2
Exit Velocity (max)
76.2
Exit Velocity (avg)
223
Distance (avg)
315
Distance (max)
Sweet Spot %
Line Drive %
Fly Ball %
Ground Ball %
Hitting

2023
2022
Hand Speed Max
The highest Peak Hand Speed of any swing in the given event year.
23.8
Hand Speed Avg
The average Peak Hand Speed for all swings in the given event year.
21.7
Bat Speed Max
The highest Bat Speed of any swing in the given event year.
83.7
Bat Speed Avg
The average Bat Speed for all swings in the given event year.
73.0
Rotational Acceleration Max
The highest Rotational Acceleration of any swing in the given event year.
Rotational Acceleration Avg
The average Rotational Acceleration for all swings in the given event year.
On-Plane Efficiency Max
The highest On-Plane Efficiency of any swing in the given event year.
On-Plane Efficiency Avg
The average On-Plane Efficiency for all swings in the given event year.
Hand Speed Max
The highest Peak Hand Speed of any swing in the given event year.
22.9
Hand Speed Avg
The average Peak Hand Speed for all swings in the given event year.
20.7
Bat Speed Max
The highest Bat Speed of any swing in the given event year.
74.3
Bat Speed Avg
The average Bat Speed for all swings in the given event year.
66.6
Rotational Acceleration Max
The highest Rotational Acceleration of any swing in the given event year.
Rotational Acceleration Avg
The average Rotational Acceleration for all swings in the given event year.
On-Plane Efficiency Max
The highest On-Plane Efficiency of any swing in the given event year.
On-Plane Efficiency Avg
The average On-Plane Efficiency for all swings in the given event year.
2023 Northeast Senior Games
Aug 8, 2023
Blast - Hitting
23.8
Hand Speed (max)
22.6
Hand Speed (avg)
76.5
Bat Speed (max)
73.1
Bat Speed (avg)
Rot. Acc (max)
Rot. Acc (avg)
On Plane Eff (avg)
MaxOnPlaneEfficiency
2023 Game On Fury Scout Day
Jul 19, 2023
Blast - Hitting
23.3
Hand Speed (max)
21.4
Hand Speed (avg)
75.7
Bat Speed (max)
72.7
Bat Speed (avg)
Rot. Acc (max)
Rot. Acc (avg)
On Plane Eff (avg)
MaxOnPlaneEfficiency
2023 NYS Games Session 2
Jun 28, 2023
Blast - Hitting
21.4
Hand Speed (max)
20.6
Hand Speed (avg)
83.7
Bat Speed (max)
73.1
Bat Speed (avg)
Rot. Acc (max)
Rot. Acc (avg)
On Plane Eff (avg)
MaxOnPlaneEfficiency
2022 NYS Games (Session 1)
Jun 27, 2022
Blast - Hitting
22.9
Hand Speed (max)
22.0
Hand Speed (avg)
74.3
Bat Speed (max)
70.2
Bat Speed (avg)
Rot. Acc (max)
Rot. Acc (avg)
On Plane Eff (avg)
MaxOnPlaneEfficiency
2022 Game On Fury Scout Day
Jun 22, 2022
Blast - Hitting
20.9
Hand Speed (max)
19.4
Hand Speed (avg)
66.2
Bat Speed (max)
63.0
Bat Speed (avg)
Rot. Acc (max)
Rot. Acc (avg)
On Plane Eff (avg)
MaxOnPlaneEfficiency
Pitching

2023
2022
Fastball
Velocity Max
The maximum observed fastball velocity in the given event year. Measured in miles per hour (MPH).
87.6
Fastball
Velocity Avg
The average velocity for all pitches of this type in the given event year. Measured in miles per hour (MPH).
84.8
Fastball
Spin Rate Avg
The average rate of spin for all pitches of this type in the given event year. Measured in rotations per minute (RPM).
1806
Fastball
Spin Score Avg
The average Bauer Units value of all fastballs in the given event year. Bauer Units are calculated for each pitch by dividing Spin Rate by Velocity.
21.3
Fastball
Total Movement Avg
The average total non-gravity movement for all pitches of this type in the given event year. Measured in inches (in).
Curveball
Velocity Avg
The average velocity for all pitches of this type in the given event year. Measured in miles per hour (MPH).
67.0
Curveball
Spin Rate Avg
The average rate of spin for all pitches of this type in the given event year. Measured in rotations per minute (RPM).
1510
Curveball
Total Movement Avg
The average total non-gravity movement for all pitches of this type in the given event year. Measured in inches (in).
Changeup
Velocity Avg
The average velocity for all pitches of this type in the given event year. Measured in miles per hour (MPH).
72.1
Changeup
Spin Rate Avg
The average rate of spin for all pitches of this type in the given event year. Measured in rotations per minute (RPM).
1183
Changeup
Total Movement Avg
The average total non-gravity movement for all pitches of this type in the given event year. Measured in inches (in).
Fastball
Velocity Max
The maximum observed fastball velocity in the given event year. Measured in miles per hour (MPH).
80.9
Fastball
Velocity Avg
The average velocity for all pitches of this type in the given event year. Measured in miles per hour (MPH).
76.1
Fastball
Spin Rate Avg
The average rate of spin for all pitches of this type in the given event year. Measured in rotations per minute (RPM).
1633
Fastball
Spin Score Avg
The average Bauer Units value of all fastballs in the given event year. Bauer Units are calculated for each pitch by dividing Spin Rate by Velocity.
21.5
Fastball
Total Movement Avg
The average total non-gravity movement for all pitches of this type in the given event year. Measured in inches (in).
Curveball
Velocity Avg
The average velocity for all pitches of this type in the given event year. Measured in miles per hour (MPH).
63.7
Curveball
Spin Rate Avg
The average rate of spin for all pitches of this type in the given event year. Measured in rotations per minute (RPM).
1253
Curveball
Total Movement Avg
The average total non-gravity movement for all pitches of this type in the given event year. Measured in inches (in).
Changeup
Velocity Avg
The average velocity for all pitches of this type in the given event year. Measured in miles per hour (MPH).
66.1
Changeup
Spin Rate Avg
The average rate of spin for all pitches of this type in the given event year. Measured in rotations per minute (RPM).
1111
Changeup
Total Movement Avg
The average total non-gravity movement for all pitches of this type in the given event year. Measured in inches (in).
Sinker
Velocity Avg
The average velocity for all pitches of this type in the given event year. Measured in miles per hour (MPH).
77.0
Sinker
Spin Rate Avg
The average rate of spin for all pitches of this type in the given event year. Measured in rotations per minute (RPM).
1676
Sinker
Total Movement Avg
The average total non-gravity movement for all pitches of this type in the given event year. Measured in inches (in).
2023 Northeast Senior Games
Aug 8, 2023
Trackman - Fastball
87.5
Velocity (max)
82.4 - 86.3
Velo Range
85.7
Eff Velocity (avg)
2,013
Spin Rate (max)
1,828
Spin Rate (avg)
IVB (max)
IVB (avg)
HM (max)
HM (avg)
Extension (avg)
Release Ht (avg)
Spin Score (max)
Zone %
Spin Efficiency % (avg)
Trackman - Curveball
68.1
Velocity (max)
65.9 - 67.6
Velo Range
67.1
Eff Velocity (avg)
1,595
Spin Rate (max)
1,491
Spin Rate (avg)
IVB (max)
IVB (avg)
HM (max)
HM (avg)
Extension (avg)
Release Ht (avg)
Spin Score (max)
Zone %
Spin Efficiency % (avg)
2023 Game On Fury Scout Day
Jul 19, 2023
Trackman - Fastball
86.7
Velocity (max)
85.0 - 86.7
Velo Range
87.6
Eff Velocity (avg)
2,053
Spin Rate (max)
1,975
Spin Rate (avg)
IVB (max)
IVB (avg)
HM (max)
HM (avg)
Extension (avg)
Release Ht (avg)
Spin Score (max)
Zone %
Spin Efficiency % (avg)
Trackman - Curveball
65.9
Velocity (max)
64.9 - 65.9
Velo Range
64.9
Eff Velocity (avg)
1,554
Spin Rate (max)
1,554
Spin Rate (avg)
IVB (max)
IVB (avg)
HM (max)
HM (avg)
Extension (avg)
Release Ht (avg)
Spin Score (max)
Spin Efficiency % (avg)
Trackman - ChangeUp
73.0
Velocity (max)
71.6 - 73.0
Velo Range
73.9
Eff Velocity (avg)
1,317
Spin Rate (max)
1,263
Spin Rate (avg)
IVB (max)
IVB (avg)
HM (max)
HM (avg)
Extension (avg)
Release Ht (avg)
Spin Score (max)
Spin Efficiency % (avg)
2023 NYS Games Session 2
Jun 28, 2023
Trackman - Fastball
87.6
Velocity (max)
83.8 - 86.4
Velo Range
85.8
Eff Velocity (avg)
1,799
Spin Rate (max)
1,676
Spin Rate (avg)
IVB (max)
IVB (avg)
HM (max)
HM (avg)
Extension (avg)
Release Ht (avg)
Spin Score (max)
Zone %
Spin Efficiency % (avg)
Trackman - Curveball
69.1
Velocity (max)
68.6 - 69.1
Velo Range
69.1
Eff Velocity (avg)
1,633
Spin Rate (max)
1,539
Spin Rate (avg)
IVB (max)
IVB (avg)
HM (max)
HM (avg)
Extension (avg)
Release Ht (avg)
Spin Score (max)
Spin Efficiency % (avg)
Trackman - ChangeUp
71.6
Velocity (max)
73.5
Eff Velocity (avg)
1,022
Spin Rate (max)
1,022
Spin Rate (avg)
IVB (max)
IVB (avg)
HM (max)
HM (avg)
Extension (avg)
Release Ht (avg)
Spin Score (max)
Spin Efficiency % (avg)
2022 NYS Games (Session 1)
Jun 27, 2022
Trackman - Fastball
79.6
Velocity (max)
73.6 - 77.4
Velo Range
75.7
Eff Velocity (avg)
1,796
Spin Rate (max)
1,623
Spin Rate (avg)
IVB (max)
IVB (avg)
HM (max)
HM (avg)
Extension (avg)
Release Ht (avg)
Spin Score (max)
Zone %
Trackman - Curveball
65.6
Velocity (max)
61.9 - 65.6
Velo Range
62.9
Eff Velocity (avg)
1,372
Spin Rate (max)
1,254
Spin Rate (avg)
IVB (max)
IVB (avg)
HM (max)
HM (avg)
Extension (avg)
Release Ht (avg)
Spin Score (max)
Zone %
2022 Game On Fury Scout Day
Jun 22, 2022
Trackman - Fastball
80.9
Velocity (max)
76.1 - 79.2
Velo Range
77.6
Eff Velocity (avg)
1,809
Spin Rate (max)
1,661
Spin Rate (avg)
IVB (max)
IVB (avg)
HM (max)
HM (avg)
Extension (avg)
Release Ht (avg)
Spin Score (max)
Trackman - Curveball
65.3
Velocity (max)
61.9 - 65.2
Velo Range
62.5
Eff Velocity (avg)
1,319
Spin Rate (max)
1,246
Spin Rate (avg)
IVB (max)
IVB (avg)
HM (max)
HM (avg)
Extension (avg)
Release Ht (avg)
Spin Score (max)
Zone %
Trackman - ChangeUp
66.1
Velocity (max)
1,111
Spin Rate (max)
1,111
Spin Rate (avg)
IVB (max)
IVB (avg)
HM (max)
HM (avg)
Release Ht (avg)
Spin Score (max)
Zone %
Trackman - Sinker
77.0
Velocity (max)
76.7
Eff Velocity (avg)
1,676
Spin Rate (max)
1,676
Spin Rate (avg)
IVB (max)
IVB (avg)
HM (max)
HM (avg)
Extension (avg)
Release Ht (avg)
Spin Score (max)
Zone %
Pitch Scores
2023
2022
Fastball
Hop+
A fastball with hop has a flat approach angle and visually jumps through the zone. When thrown up in the zone, it is more likely to generate a higher swing and miss average. Hop+ of 100 is MLB average.
Fastball
Sink+
A fastball with sink has low backspin and drops through the strike zone. When thrown down in the zone, it is more likely to generate a higher ground ball percentage and lower launch angle. Sink+ of 100 is MLB average.
Fastball
Rise+
A fastball with rise has a high percentage of backspin. When thrown up in the zone, it is more likely to generate a higher fly ball percentage. Rise+ of 100 is MLB average
Curveball
Hammer+
A hammer breaking ball drops vertically with velocity through the zone, or 12-to-6 movement. Hammer+ of 100 is MLB average.
Curveball
Sweep+
A sweeping breaking ball moves horizontally with velocity through the zone. Sweep+ of 100 is MLB average.
Fastball
Hop+
A fastball with hop has a flat approach angle and visually jumps through the zone. When thrown up in the zone, it is more likely to generate a higher swing and miss average. Hop+ of 100 is MLB average.
Fastball
Sink+
A fastball with sink has low backspin and drops through the strike zone. When thrown down in the zone, it is more likely to generate a higher ground ball percentage and lower launch angle. Sink+ of 100 is MLB average.
Fastball
Rise+
A fastball with rise has a high percentage of backspin. When thrown up in the zone, it is more likely to generate a higher fly ball percentage. Rise+ of 100 is MLB average
Curveball
Hammer+
A hammer breaking ball drops vertically with velocity through the zone, or 12-to-6 movement. Hammer+ of 100 is MLB average.
Curveball
Sweep+
A sweeping breaking ball moves horizontally with velocity through the zone. Sweep+ of 100 is MLB average.
Pitching Velos
2023
Fastball
Velocity Max
The maximum observed fastball velocity in the given event year. Measured in miles per hour (MPH).
88.0
Fastball
Velocity Avg
The average velocity for all pitches of this type in the given event year. Measured in miles per hour (MPH)
84.0
Curveball
Velocity Avg
The average velocity for all pitches of this type in the given event year. Measured in miles per hour (MPH)
67.0
Game Performance

2023
2022
10 Yard Dash
The athlete's fastest 0-10-yard split time in the given event year. Measured in seconds.
1.81
30 Yard Dash
The athlete's fastest 0-30-yard split time in the given event year. Measured in seconds.
4.20
60 Yard Dash
The athlete's fastest 0-60-yard time in the given event year. Measured in seconds.
7.55
Top Speed (MPH)
The athlete's fastest split time converted to miles per hour.
10 Yard Dash
The athlete's fastest 0-10-yard split time in the given event year. Measured in seconds.
1.75
30 Yard Dash
The athlete's fastest 0-30-yard split time in the given event year. Measured in seconds.
4.29
60 Yard Dash
The athlete's fastest 0-60-yard time in the given event year. Measured in seconds.
7.83
Top Speed (MPH)
The athlete's fastest split time converted to miles per hour.
RSi
The reactive strength index measurement of an athlete's explosiveness by comparing their jump height to the ground contact time in between their jumps. On a scale of 0-5.
Vertical Jump
A measure of any athlete's body strength and reach calculated from the flight time divided by the contact time.
2022 NYS Games (Session 1)
Jun 27, 2022
Swift
1.75
10-yd
4.29
30-yd
7.84
60-yd
17.3
Run speed (max)
7.7
Run Speed (avg)
0.99
RSi (max)
0.99
RSi (avg)
1,665
Jump Power (max)
22.9
Jump Height (max)
22.6
Jump Height (avg)
Visual Edge

2023
2022
Edge Score
The highest Edge Score within the given year. Edge Score is a comprehensive score that takes the core-six visual skills into account, providing an assessment of an athlete’s overall visual ability.
71.61
Edge Score
The highest Edge Score within the given year. Edge Score is a comprehensive score that takes the core-six visual skills into account, providing an assessment of an athlete’s overall visual ability.
54.34
Pitch Ai

Notes
News
Comments
Draft Reports
Contact
Premium Content Area
To unlock contact information, you need to purchase a ScoutPLUS subscription.
Purchase Subscription OR
Login
Physical
2023
Grip Strgth (LH)
Grip strength is a measure of a players bat control and ability to transfer power and speed during impact, measured in pounds of force generated; collected with elbow bent at 90 degrees.
Grip Strgth (RH)
Grip strength is a measure of a players bat control and ability to transfer power and speed during impact, measured in pounds of force generated; collected with elbow bent at 90 degrees.







 Sign in to view rankings
Physical: 6-4, 215 pounds; Long, sturdy build. 7.61 runner in the 60.
Offensively: RHH. Even setup, with feet narrow; upright bat position. Loads straight back with an up and down stride for timing. Stays behind the ball while showing a strong lower half. Showed a direct swing path with a two handed finish. More flyballs than line drives and groundballs with a peak exit velocity of 90 MPH via Trackman. Shows a simple stretch with the hands, with power to the gaps..
Defensively: Starts with an upright /tall setup; static during pre-pitch while showing choppy feet. Hands are off to the side with a clean transfer. Moderate arm circle from a high/over the top arm slot. OF - 90 MPH.
Pitching: Uses a glove side setup working primarily from the stretch. Belt high leg drive with a slight coil away from the plate. Has a long stride landing inline with the plate. Moderate arm swing while stabbing downward; standard 3/4 slot. Spins off 1B side with finish. FB: Peak velo of 88 MPH, while sitting 84-87 MPH; plays up in the zone. CB: 66-88 MPH; showed depth.
Physical: 6-3, 205 pounds; Long, sturdy build. 7.55 runner in the 60.
Offensively: RHH. Even setup, with feet narrow; upright bat position. Loads straight back with an up and down stride for timing. Stays behind the ball while showing a strong lower half. Showed a compact swing path with a two handed finish. More line drives than flyballs and groundballs with a peak exit velocity of 96 MPH via Trackman. Simple approach with power to all parts of the field.
Defensively: Starts with an upright /tall setup; static during pre-pitch while showing choppy feet. Hands are off to the side with a clean transfer. Moderate arm circle from a high 3/4 arm slot. OF - 86 MPH.
Pitching: Uses a glove side setup working primarily from the stretch. Belt high leg drive with shoulders above the hips. Has a moderate stride landing inline with the plate. Moderate arm swing while arm stays in line with 2B; high 3/4 slot. Spins off 1B side with finish. FB: Peak velo of 88 MPH, while sitting 84-86 MPH; plays up in the zone. CB: 67-69 MPH; early action. CH: 72 MPH; fading action.
Physical: 6-foot-3, 205 pounds; Long, proportional build. 7.84 runner in the 60.
Offensively: RHH. Even setup, with feet shoulder width apart; bat positioned at a 45 degree angle. Loads straight back with a slight leg-kick for timing. Slides weight forward pre-contact. while showing an aggressive lower half. Showed a short swing path with a two handed finish. More line drives than flyballs and groundballs with a peak exit velocity of 91 MPH via Trackman. feel for the barrel with plus bat speed & developing power.
Defensively: Starts with an upright /tall setup; uses prep hop while showing choppy feet. Hands are out in front with a seamless transfer. Moderate arm circle from a standard 3/4 arm slot. OF - 79 MPH.
Pitching: Uses a center rubber setup while using a side step. Belt high leg drive with a slight lean over the belt. Has a long stride landing inline with the plate. Moderate arm swing while showing no restrictions; high 3/4 slot. Spins off 1B side with finish. FB: Peak velo of 80 MPH, while sitting 76-79 MPH; heavy flashing ride and run. CB: 61-64 MPH; 11-5 shape with plus movement.