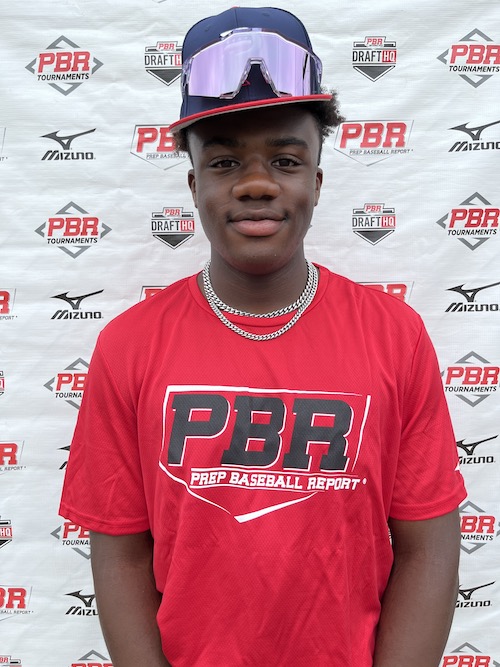
CLASS OF 2025
1B
OF
Donavan
Jeffrey
PDG academy (HS) • VA
6' 2" • 215LBS
R/R • 17yr 10mo
Travel Team: Canes national 17u
6' 2" • 215LBS
R/R • 17yr 10mo
Travel Team: Canes national 17u
Rankings
2025 National
Rankings available to Premium Subscriber
2025 State
Rankings available to Premium Subscriber
Commitment
Best Of Stats
25.5
Hand Speed (max)
8/13/23
80.2
Bat Speed (max)
8/13/23
17.5
Rot. Acc (max)
11/05/22
78
Hard Hit %
8/13/23
103.3
Exit Velocity (max)
7/27/22
94.3
Exit Velocity (avg)
8/13/23
394
Distance (max)
11/05/22
61
Sweet Spot %
8/13/23
6.73
60
6/21/22
3.79
30-yd
8/13/23
1.68
10-yd
8/13/23
20.6
Run speed (max)
8/13/23
86
INF Velo
8/13/23
-
OF Velo
-
C Velo
-
Pop Time
Fastball
85
Velocity (max)
7/22/21
80 - 85
Velo Range
7/22/21
-
Spin Rate (avg)
Curveball
73 - 76
Velo Range
7/22/21
-
Spin Rate (avg)
Positional Tools
2023
2022
60 Yard Dash
The athlete's fastest 60-yard dash time in the given event year. Measured in seconds (s)
6.78
Infield Velocity
The athlete's maximum throwing velocity from an infield position in the given event year. Measured in miles per hour (MPH).
86.0
Power / Speed Score
A simple calculation that divides the athlete’s Exit Velocity Max by the athlete’s 60 Yard Dash time for the given event year. For example, 98 MPH / 7.00s = 14.00.
14.7
60 Yard Dash
The athlete's fastest 60-yard dash time in the given event year. Measured in seconds (s)
6.73
Infield Velocity
The athlete's maximum throwing velocity from an infield position in the given event year. Measured in miles per hour (MPH).
82.0
Power / Speed Score
A simple calculation that divides the athlete’s Exit Velocity Max by the athlete’s 60 Yard Dash time for the given event year. For example, 98 MPH / 7.00s = 14.00.
14.7
Hitting

2023
2022
Exit Velocity Max
The highest exit velocity of any batted ball in the given event year. Measured in miles per hour (MPH).
100.0
Exit Velocity Avg
Average exit velocity of all batted balls in the given event year. Measured in miles per hour (MPH).
94.3
Distance Max
The highest flight distance of any batted ball in the given event year. Measured in feet (ft).
349
Distance Avg
Average flight distance of all batted balls in the given event year. Measured in feet (ft).
231
Launch Angle Avg
Average launch angle of all batted balls in the given event year. Measured in degrees.
17.1
Hard Hit %
Percentage of batted balls with exit velocities over 95 MPH in the given event year.
Sweet Spot %
Percentage of batted balls in the given event year with a launch angle between 8° and 32°.
Line Drive %
Percentage of batted balls with launch angles between 10 and 25 degrees in the given event year.
Fly Ball %
Percentage of batted balls with launch angles between 25 and 50 degrees in the given event year.
Ground Ball %
Percentage of batted balls with launch angles below 10 degrees in the given event year.
Exit Velocity Max
The highest exit velocity of any batted ball in the given event year. Measured in miles per hour (MPH).
98.9
Exit Velocity Avg
Average exit velocity of all batted balls in the given event year. Measured in miles per hour (MPH).
92.4
Distance Max
The highest flight distance of any batted ball in the given event year. Measured in feet (ft).
394
Distance Avg
Average flight distance of all batted balls in the given event year. Measured in feet (ft).
219
Launch Angle Avg
Average launch angle of all batted balls in the given event year. Measured in degrees.
16.7
Hard Hit %
Percentage of batted balls with exit velocities over 95 MPH in the given event year.
Sweet Spot %
Percentage of batted balls in the given event year with a launch angle between 8° and 32°.
Line Drive %
Percentage of batted balls with launch angles between 10 and 25 degrees in the given event year.
Fly Ball %
Percentage of batted balls with launch angles between 25 and 50 degrees in the given event year.
Ground Ball %
Percentage of batted balls with launch angles below 10 degrees in the given event year.
2023 Mid-Atlantic Procase
Aug 13, 2023
Trackman - Hitting
100.0
Exit Velocity (max)
94.3
Exit Velocity (avg)
231
Distance (avg)
349
Distance (max)
Hard Hit %
Sweet Spot %
Line Drive %
Fly Ball %
Ground Ball %
2022 Mid-Atlantic State Games
Nov 5, 2022
Trackman - Hitting
98.9
Exit Velocity (max)
93.4
Exit Velocity (avg)
250
Distance (avg)
394
Distance (max)
Hard Hit %
Barrel %
Sweet Spot %
Line Drive %
Fly Ball %
Ground Ball %
2022 PBR Future Games
Jul 27, 2022
Trackman - Hitting
103.3
Exit Velocity (max)
89.5
Exit Velocity (avg)
272
Distance (avg)
368
Distance (max)
Hard Hit %
Sweet Spot %
Line Drive %
Fly Ball %
Ground Ball %
2022 Virginia/DC State Games (Underclass)
Jun 21, 2022
Trackman - Hitting
97.4
Exit Velocity (max)
90.7
Exit Velocity (avg)
168
Distance (avg)
336
Distance (max)
Hard Hit %
Sweet Spot %
Line Drive %
Ground Ball %
Hitting

2023
2022
Hand Speed Max
The highest Peak Hand Speed of any swing in the given event year.
25.5
Hand Speed Avg
The average Peak Hand Speed for all swings in the given event year.
22.7
Bat Speed Max
The highest Bat Speed of any swing in the given event year.
80.2
Bat Speed Avg
The average Bat Speed for all swings in the given event year.
75.2
Rotational Acceleration Max
The highest Rotational Acceleration of any swing in the given event year.
Rotational Acceleration Avg
The average Rotational Acceleration for all swings in the given event year.
On-Plane Efficiency Max
The highest On-Plane Efficiency of any swing in the given event year.
On-Plane Efficiency Avg
The average On-Plane Efficiency for all swings in the given event year.
Hand Speed Max
The highest Peak Hand Speed of any swing in the given event year.
24.6
Hand Speed Avg
The average Peak Hand Speed for all swings in the given event year.
21.7
Bat Speed Max
The highest Bat Speed of any swing in the given event year.
78.1
Bat Speed Avg
The average Bat Speed for all swings in the given event year.
72.2
Rotational Acceleration Max
The highest Rotational Acceleration of any swing in the given event year.
Rotational Acceleration Avg
The average Rotational Acceleration for all swings in the given event year.
On-Plane Efficiency Max
The highest On-Plane Efficiency of any swing in the given event year.
On-Plane Efficiency Avg
The average On-Plane Efficiency for all swings in the given event year.
2023 Mid-Atlantic Procase
Aug 13, 2023
Blast - Hitting
25.5
Hand Speed (max)
22.7
Hand Speed (avg)
80.2
Bat Speed (max)
75.2
Bat Speed (avg)
Rot. Acc (max)
Rot. Acc (avg)
On Plane Eff (avg)
MaxOnPlaneEfficiency
2022 Mid-Atlantic State Games
Nov 5, 2022
Blast - Hitting
23.2
Hand Speed (max)
21.8
Hand Speed (avg)
78.1
Bat Speed (max)
74.9
Bat Speed (avg)
Rot. Acc (max)
Rot. Acc (avg)
On Plane Eff (avg)
MaxOnPlaneEfficiency
2022 PBR Future Games
Jul 27, 2022
Blast - Hitting
22.6
Hand Speed (max)
22.0
Hand Speed (avg)
76.0
Bat Speed (max)
70.2
Bat Speed (avg)
Rot. Acc (max)
Rot. Acc (avg)
On Plane Eff (avg)
MaxOnPlaneEfficiency
2022 Virginia/DC State Games (Underclass)
Jun 21, 2022
Blast - Hitting
24.6
Hand Speed (max)
21.3
Hand Speed (avg)
78.1
Bat Speed (max)
70.3
Bat Speed (avg)
Rot. Acc (max)
Rot. Acc (avg)
On Plane Eff (avg)
MaxOnPlaneEfficiency
Pitching

Pitch Scores
Pitching Velos
2022
2021
Fastball
Velocity Max
The maximum observed fastball velocity in the given event year. Measured in miles per hour (MPH).
83.0
Fastball
Velocity Avg
The average velocity for all pitches of this type in the given event year. Measured in miles per hour (MPH)
81.5
Fastball
Velocity Max
The maximum observed fastball velocity in the given event year. Measured in miles per hour (MPH).
85.0
Fastball
Velocity Avg
The average velocity for all pitches of this type in the given event year. Measured in miles per hour (MPH)
82.5
Curveball
Velocity Avg
The average velocity for all pitches of this type in the given event year. Measured in miles per hour (MPH)
74.5
Game Performance

2023
10 Yard Dash
The athlete's fastest 0-10-yard split time in the given event year. Measured in seconds.
1.68
30 Yard Dash
The athlete's fastest 0-30-yard split time in the given event year. Measured in seconds.
3.79
60 Yard Dash
The athlete's fastest 0-60-yard time in the given event year. Measured in seconds.
6.78
Top Speed (MPH)
The athlete's fastest split time converted to miles per hour.
2022 PBR Future Games
Jul 27, 2022
Swift
1.62
10-yd
3.83
30-yd
6.94
60-yd
19.7
Run speed (max)
8.6
Run Speed (avg)
1.95
RSi (max)
1.95
RSi (avg)
1,805
Jump Power (max)
26.4
Jump Height (max)
26.0
Jump Height (avg)
Visual Edge

2023
2022
Edge Score
The highest Edge Score within the given year. Edge Score is a comprehensive score that takes the core-six visual skills into account, providing an assessment of an athlete’s overall visual ability.
65.84
Edge Score
The highest Edge Score within the given year. Edge Score is a comprehensive score that takes the core-six visual skills into account, providing an assessment of an athlete’s overall visual ability.
64.45
Pitch Ai

Notes
News
- 2023 VA/DC Preseason All-State: Underclass Team - Mar 17, 2023
- VHSL 6A Spring Forward Previews: Region A - Mar 7, 2023
- 2022 VA/DC Most Viewed Profiles: No. 2 - Jan 13, 2023
- VA/DC Class of 2025 Rankings Update: Top 25 - Dec 5, 2022
- Summer State Games Spotlights: Uncommitted Infielders - Oct 11, 2022
- VA/DC Class of 2025: Updated Top 25 - Aug 29, 2022
- Future Games: Shooter's Top Prospects (2025) - Aug 11, 2022
- Future Games Team Mid-Atlantic: Game 1 Highlights - Jul 29, 2022
- Future Games: Team Mid-Atlantic Workout Notes - Jul 27, 2022
- Future Games: Team Mid-Atlantic, Part 1 - Jul 25, 2022
- Top Position Players Coming To Future Games - Jul 13, 2022
- VA/DC Class of 2025 Rankings Update: Top 25 - Jul 11, 2022
- Underclass State Games Superlatives: Most Projectable Athlete - Jul 1, 2022
- 2022 All-PBR VA/DC - Jul 1, 2022
- Underclass State Games Superlatives: Speedsters - Jun 29, 2022
- Underclass State Games Superlatives: Best Hit Tool - Jun 28, 2022
- Underclass State Games Superlatives: Top Raw Power - Jun 27, 2022
- VA/DC Underclass State Games: Naill's Quick Hits - Jun 24, 2022
- VA/DC Underclass State Games: Burton's Quick Hits - Jun 23, 2022
- VA/DC Scout Blog: Manchester at Clover Hill - May 4, 2022
- VA/DC Scout Blog: Richmond Wrap Up - Apr 15, 2022
- Spring Forward: RVA Uncommitted - Feb 15, 2022
- VA/DC Pick 5 Draft: Richmond - Jan 10, 2022
- Introduction To The Class Of 2025 - Dec 1, 2021
Comments
Draft Reports
Contact
Premium Content Area
To unlock contact information, you need to purchase a ScoutPLUS subscription.
Purchase Subscription OR
Login


 Sign in to view rankings
Positional Profile: 1B/OF Big time power bat with loads of potential.
Body: 6-2, 210-pounds. Athletic physical frame.
Hits: RHH. Rhythmic, balanced set up. Quick, whippy barrel with slightly uphill bat path.
Power: 99 max exit velocity, averaged 93.4 MPH. 394' max distance. Constant loud contact with power to all fields.
Arm: RH. Short, quick arm action.
Defense: Clean hands, with athletic movements.
6-foot-2, 201-pound strong athletic build. Advanced confident during BP, Jeffrey displayed an exit velocity of 97 mph. Ranked #3 with EV at the event (70.3mph bat speed average, 21.3 mph hand speed average). Began in a balanced quiet stance with a smooth rhythmic load, then used. controlled small leg kick. Bat speed is electric, exhibits a simple upward swing plane and a high, good extension on his finish. During his round he produced tons of loud contact and found multiple barrels. Line drive aggressive approach. Athletic in the infield, recorded a position velocity of 82 mph; had soft hands, a clean exchange, and athletics footwork. Movements laterally were athletic and he fields the ball out front. Showed a longer quick arm action on his throws. Showed his athleticism during the event with a sub-seven 60 time of 6.73.