CLASS OF 2024
LHP
Ethan
Plog
Louisiana State
Bay Port (HS) • WI
6' 2" • 185LBS
R/L • 19yr 2mo
Travel Team: GRB Rays North
Bay Port (HS) • WI
6' 2" • 185LBS
R/L • 19yr 2mo
Travel Team: GRB Rays North
Rankings
2024 National
Rankings available to Premium Subscriber
2024 State
Rankings available to Premium Subscriber
Commitment
Best Of Stats

Fastball
92.9
Velocity (max)
10/17/24
90.8 - 92.6
Velo Range
10/17/24
2266
Spin Rate (avg)
10/17/24
Changeup
79 - 82
Velo Range
3/26/24
2141
Spin Rate (avg)
10/17/24
Curveball
77 - 80
Velo Range
6/29/23
2569
Spin Rate (avg)
10/17/24
Slider
77 - 79
Velo Range
3/26/24
2633
Spin Rate (avg)
10/17/24

90.9
Exit Velocity (max)
2/25/23
82.1
Exit Velocity (avg)
2/25/23
305
Distance (max)
2/25/23
60
Sweet Spot %
2/25/23

24
Hand Speed (max)
2/25/23
76.1
Bat Speed (max)
2/25/23
25.1
Rot. Acc (max)
2/25/23
20
Hard Hit %
2/25/23

6.90
60-yd
2/25/23
3.81
30-yd
2/25/23
1.64
10-yd
2/25/23
19.9
Run speed (max)
2/25/23

-
INF Velo
88
OF Velo
2/25/23
-
C Velo
-
Pop Time
Positional Tools
2023
60 Yard Dash
The athlete's fastest 60-yard dash time in the given event year. Measured in seconds (s)
6.90
Outfield Velocity
The athlete's maximum throwing velocity from an outfield position in the given event year. Measured in miles per hour (MPH).
88.0
Power / Speed Score
A simple calculation that divides the athlete’s Exit Velocity Max by the athlete’s 60 Yard Dash time for the given event year. For example, 98 MPH / 7.00s = 14.00.
13.2
Hitting

2023
Exit Velocity Max
The highest exit velocity of any batted ball in the given event year. Measured in miles per hour (MPH).
90.9
Exit Velocity Avg
Average exit velocity of all batted balls in the given event year. Measured in miles per hour (MPH).
82.1
Distance Max
The highest flight distance of any batted ball in the given event year. Measured in feet (ft).
305
Distance Avg
Average flight distance of all batted balls in the given event year. Measured in feet (ft).
166
Launch Angle Avg
Average launch angle of all batted balls in the given event year. Measured in degrees.
15.2
Hard Hit %
Percentage of batted balls with exit velocities over 95 MPH in the given event year.
Sweet Spot %
Percentage of batted balls in the given event year with a launch angle between 8° and 32°.
Line Drive %
Percentage of batted balls with launch angles between 10 and 25 degrees in the given event year.
Fly Ball %
Percentage of batted balls with launch angles between 25 and 50 degrees in the given event year.
Ground Ball %
Percentage of batted balls with launch angles below 10 degrees in the given event year.
Green Bay Preseason ID
Feb 25, 2023
Trackman - Hitting
90.9
Exit Velocity (max)
82.1
Exit Velocity (avg)
166
Distance (avg)
305
Distance (max)
Hard Hit %
Sweet Spot %
Line Drive %
Fly Ball %
Ground Ball %
Hitting

2023
Hand Speed Max
The highest Peak Hand Speed of any swing in the given event year.
24.0
Hand Speed Avg
The average Peak Hand Speed for all swings in the given event year.
22.8
Bat Speed Max
The highest Bat Speed of any swing in the given event year.
76.1
Bat Speed Avg
The average Bat Speed for all swings in the given event year.
70.3
Rotational Acceleration Max
The highest Rotational Acceleration of any swing in the given event year.
Rotational Acceleration Avg
The average Rotational Acceleration for all swings in the given event year.
On-Plane Efficiency Max
The highest On-Plane Efficiency of any swing in the given event year.
On-Plane Efficiency Avg
The average On-Plane Efficiency for all swings in the given event year.
Green Bay Preseason ID
Feb 25, 2023
Blast - Hitting
24.0
Hand Speed (max)
22.8
Hand Speed (avg)
76.1
Bat Speed (max)
70.3
Bat Speed (avg)
Rot. Acc (max)
Rot. Acc (avg)
On Plane Eff (avg)
MaxOnPlaneEfficiency
Pitching

2024
2023
Fastball
Velocity Max
The maximum observed fastball velocity in the given event year. Measured in miles per hour (MPH).
92.9
Fastball
Velocity Avg
The average velocity for all pitches of this type in the given event year. Measured in miles per hour (MPH).
91.7
Fastball
Spin Rate Avg
The average rate of spin for all pitches of this type in the given event year. Measured in rotations per minute (RPM).
2266
Fastball
Spin Score Avg
The average Bauer Units value of all fastballs in the given event year. Bauer Units are calculated for each pitch by dividing Spin Rate by Velocity.
24.7
Fastball
Total Movement Avg
The average total non-gravity movement for all pitches of this type in the given event year. Measured in inches (in).
Curveball
Velocity Avg
The average velocity for all pitches of this type in the given event year. Measured in miles per hour (MPH).
75.8
Curveball
Spin Rate Avg
The average rate of spin for all pitches of this type in the given event year. Measured in rotations per minute (RPM).
2569
Curveball
Total Movement Avg
The average total non-gravity movement for all pitches of this type in the given event year. Measured in inches (in).
Changeup
Velocity Avg
The average velocity for all pitches of this type in the given event year. Measured in miles per hour (MPH).
78.9
Changeup
Spin Rate Avg
The average rate of spin for all pitches of this type in the given event year. Measured in rotations per minute (RPM).
2141
Changeup
Total Movement Avg
The average total non-gravity movement for all pitches of this type in the given event year. Measured in inches (in).
Slider
Velocity Avg
The average velocity for all pitches of this type in the given event year. Measured in miles per hour (MPH).
77.5
Slider
Spin Rate Avg
The average rate of spin for all pitches of this type in the given event year. Measured in rotations per minute (RPM).
2633
Slider
Total Movement Avg
The average total non-gravity movement for all pitches of this type in the given event year. Measured in inches (in).
Fastball
Velocity Max
The maximum observed fastball velocity in the given event year. Measured in miles per hour (MPH).
86.0
Fastball
Velocity Avg
The average velocity for all pitches of this type in the given event year. Measured in miles per hour (MPH).
84.0
Fastball
Spin Rate Avg
The average rate of spin for all pitches of this type in the given event year. Measured in rotations per minute (RPM).
2162
Fastball
Spin Score Avg
The average Bauer Units value of all fastballs in the given event year. Bauer Units are calculated for each pitch by dividing Spin Rate by Velocity.
25.7
Fastball
Total Movement Avg
The average total non-gravity movement for all pitches of this type in the given event year. Measured in inches (in).
Curveball
Velocity Avg
The average velocity for all pitches of this type in the given event year. Measured in miles per hour (MPH).
74.9
Curveball
Spin Rate Avg
The average rate of spin for all pitches of this type in the given event year. Measured in rotations per minute (RPM).
2221
Curveball
Total Movement Avg
The average total non-gravity movement for all pitches of this type in the given event year. Measured in inches (in).
Changeup
Velocity Avg
The average velocity for all pitches of this type in the given event year. Measured in miles per hour (MPH).
75.5
Changeup
Spin Rate Avg
The average rate of spin for all pitches of this type in the given event year. Measured in rotations per minute (RPM).
1930
Changeup
Total Movement Avg
The average total non-gravity movement for all pitches of this type in the given event year. Measured in inches (in).
IA Juco Scout Day- Iowa Western CC
Oct 17, 2024
Trackman - Fastball
92.9
Velocity (max)
90.8 - 92.6
Velo Range
89.4
Eff Velocity (avg)
2,327
Spin Rate (max)
2,266
Spin Rate (avg)
IVB (max)
IVB (avg)
HM (max)
HM (avg)
Extension (avg)
Release Ht (avg)
Spin Score (max)
Zone %
Spin Efficiency % (avg)
Trackman - Curveball
77.0
Velocity (max)
74.8 - 76.8
Velo Range
72.9
Eff Velocity (avg)
2,668
Spin Rate (max)
2,569
Spin Rate (avg)
IVB (max)
IVB (avg)
HM (max)
HM (avg)
Extension (avg)
Release Ht (avg)
Spin Score (max)
Zone %
Spin Efficiency % (avg)
Trackman - Slider
78.4
Velocity (max)
76.3 - 78.4
Velo Range
74.2
Eff Velocity (avg)
2,746
Spin Rate (max)
2,633
Spin Rate (avg)
IVB (max)
IVB (avg)
HM (max)
HM (avg)
Extension (avg)
Release Ht (avg)
Spin Score (max)
Spin Efficiency % (avg)
Trackman - ChangeUp
79.6
Velocity (max)
77.9 - 79.6
Velo Range
77.1
Eff Velocity (avg)
2,225
Spin Rate (max)
2,141
Spin Rate (avg)
IVB (max)
IVB (avg)
HM (max)
HM (avg)
Extension (avg)
Release Ht (avg)
Spin Score (max)
Zone %
Spin Efficiency % (avg)
Green Bay Preseason ID
Feb 25, 2023
Trackman - Fastball
86.0
Velocity (max)
82.8 - 85.2
Velo Range
82.6
Eff Velocity (avg)
2,222
Spin Rate (max)
2,162
Spin Rate (avg)
IVB (max)
IVB (avg)
HM (max)
HM (avg)
Extension (avg)
Release Ht (avg)
Spin Score (max)
Zone %
Spin Efficiency % (avg)
Trackman - Curveball
76.4
Velocity (max)
73.7 - 76.1
Velo Range
73.1
Eff Velocity (avg)
2,275
Spin Rate (max)
2,221
Spin Rate (avg)
IVB (max)
IVB (avg)
HM (max)
HM (avg)
Extension (avg)
Release Ht (avg)
Spin Score (max)
Zone %
Spin Efficiency % (avg)
Trackman - ChangeUp
76.9
Velocity (max)
74.5 - 76.6
Velo Range
74.2
Eff Velocity (avg)
1,958
Spin Rate (max)
1,930
Spin Rate (avg)
IVB (max)
IVB (avg)
HM (max)
HM (avg)
Extension (avg)
Release Ht (avg)
Spin Score (max)
Zone %
Spin Efficiency % (avg)
Pitch Scores
2023
Fastball
Hop+
A fastball with hop has a flat approach angle and visually jumps through the zone. When thrown up in the zone, it is more likely to generate a higher swing and miss average. Hop+ of 100 is MLB average.
Fastball
Sink+
A fastball with sink has low backspin and drops through the strike zone. When thrown down in the zone, it is more likely to generate a higher ground ball percentage and lower launch angle. Sink+ of 100 is MLB average.
Fastball
Rise+
A fastball with rise has a high percentage of backspin. When thrown up in the zone, it is more likely to generate a higher fly ball percentage. Rise+ of 100 is MLB average
Curveball
Hammer+
A hammer breaking ball drops vertically with velocity through the zone, or 12-to-6 movement. Hammer+ of 100 is MLB average.
Curveball
Sweep+
A sweeping breaking ball moves horizontally with velocity through the zone. Sweep+ of 100 is MLB average.
Pitching Velos
2024
2023
Fastball
Velocity Max
The maximum observed fastball velocity in the given event year. Measured in miles per hour (MPH).
92.0
Fastball
Velocity Avg
The average velocity for all pitches of this type in the given event year. Measured in miles per hour (MPH)
89.0
Changeup
Velocity Avg
The average velocity for all pitches of this type in the given event year. Measured in miles per hour (MPH)
80.5
Slider
Velocity Avg
The average velocity for all pitches of this type in the given event year. Measured in miles per hour (MPH)
78.0
Fastball
Velocity Max
The maximum observed fastball velocity in the given event year. Measured in miles per hour (MPH).
89.0
Fastball
Velocity Avg
The average velocity for all pitches of this type in the given event year. Measured in miles per hour (MPH)
85.5
Curveball
Velocity Avg
The average velocity for all pitches of this type in the given event year. Measured in miles per hour (MPH)
76.8
Changeup
Velocity Avg
The average velocity for all pitches of this type in the given event year. Measured in miles per hour (MPH)
76.0
Game Performance

2024
2023
10 Yard Dash
The athlete's fastest 0-10-yard split time in the given event year. Measured in seconds.
1.64
30 Yard Dash
The athlete's fastest 0-30-yard split time in the given event year. Measured in seconds.
3.81
60 Yard Dash
The athlete's fastest 0-60-yard time in the given event year. Measured in seconds.
6.90
Top Speed (MPH)
The athlete's fastest split time converted to miles per hour.
Green Bay Preseason ID
Feb 25, 2023
Swift
1.64
10-yd
3.81
30-yd
6.90
60-yd
19.9
Run speed (max)
1,750
Jump Power (max)
32.7
Jump Height (max)
32.6
Jump Height (avg)

Vizual Edge

2023
Edge Score
The highest Edge Score within the given year. Edge Score is a comprehensive score that takes the core-six visual skills into account, providing an assessment of an athlete’s overall visual ability.
54.24
Pitch Ai

Notes
News
- Preseason Top-50 JUCO Prospects - Dec 19, 2024
- 2024 Prep Baseball Wisconsin First Team All-State - Jun 24, 2024
- WIAA Diamond Notes: Week 7 - May 15, 2024
- WIAA Diamond Notes: Week 4 - Apr 25, 2024
- Q&A with Iowa Western CC Commit Ethan Plog - Dec 7, 2023
- PBR Wisconsin's WIAA All-State First Team - Jun 22, 2023
- Week 5 Diamond Notes - May 5, 2023
- Green Bay Preseason ID: Pitcher Analysis - Mar 23, 2023
- Green Bay Preseason ID: Outfield Analysis - Mar 21, 2023
- Green Bay Preseason ID: Quick Hits - Mar 1, 2023
Comments
Draft Reports
Contact
Premium Content Area
To unlock contact information, you need to purchase a ScoutPLUS subscription.
Purchase Subscription OR
Login
Iowa Western CC commit. It was more of the same on the mound for Plog in the 2024 season, as the left-hander added another All-State award to his resume after being on the First Team in 2023. Plog pitched to a 4-2 record in 2024, but that didn’t tell the entire story. The southpaw tallied 73 strikeouts in 39.1 innings pitched—allowing four earned runs during the season to maintain his status as one of the top performers in the 2024 class. Plog earned one no-hitter during the 2024 season, in addition to his four complete games and two one-hitters. He was dominant every time he took the mound, all while taking on the role of closer, too. Plog racked up two saves during the season—showcasing his versatility for the Pirates and their pitching staff. After a storied prep career, Plog now takes his talents to the next level as an intriguing left-hander.
Iowa Western CC commit, Plog has been one of the top performers in the WIAA for the last two springs and continued his success against Sheboygan North. In the start Plog tossed six innings allowing no hits and no walks while striking out 14 total batters.
Uncommitted. Plog was a key piece in Bay Port’s 3-1 win over Manitowoc Lincoln. On the mound Plog tossed a complete game allowing one unearned run and a hit while striking out 10 batters.
Uncommitted. Plog led Bayport to a win in his complete game against Pulaski. During his start he struckout 11 batters while allowing a hit and a walk while maintaining a 67% strike rate throughout his start.
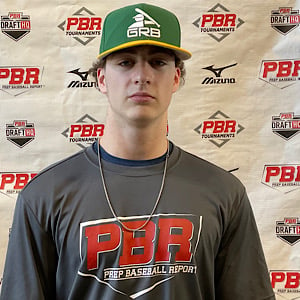
Making his PBR showcase debut, LHP Ethan Plog (Bay Port, 2024) is a name who our staff had been familiar with already prior to Saturday, as he’d previously shown well in live game settings across the summer’s tournament scene. Standing at a projectable 6-foot, 165-pounds, the southpaw features an uptempo, drop-and-drive delivery and he works in-line to home. His low ¾ arm slot helps him create a max of 17.1 inches of horizontal break on his fastball that topped at 86 mph, and sat in the 83-85 range. As for his offspeeds, is still developing some feel on a 1/7 breaking ball but he is able to spin it in the 2,200 rpm range, which is above-average. His best secondary is a changeup and he showed confidence in it as it played with late fade/depth.
Positional Profile: LHP/OF
Body: 6-0, 165-pounds. Wiry frame, athletic.
Delivery: Up tempo, drop and drive delivery, works in-line.
Arm Action: LH. Low 3/4, quick arm.
FB: T86, 83-85 mph. Arm-side run, firm. T2222, 2162 average rpm.
CB: 74-76 mph. Developing feel, 1/7 shape. T2275, 2221 average rpm.
CH: 75-77 mph. Feel for pitch, fading action with depth. T1958, 1930 average rpm.
Positional Profile: LHP/OF
Body: 6-0, 165-pounds. Wiry frame, athletic.
Hits: RHH. Upright set up with relaxed hands. Simple centered move under control and in balance, direct hand path impacts line drives to both gaps.
Power: 91 max exit velocity, averaged 82.1 MPH. 305' max distance.
Arm: LH. OF-88 mph. 3/4 slot, quick arm.
Defense: One-hand gather, shuffle step towards target with medium leg swing finish.
Run: 6.90 runner in the 60.
Vizual Edge: 54.24 Edge Score
Projectable arm coming in at 6-foot 160-poounds. Simple, easy drop and drive delivery that has some funk to it. Featuring two pitches that produce swings and misses often, fastball 79-81 mph, and a breaking ball 70-73 mph. Through 5.2 innings he collected 11 strikeouts while only giving up two hits, four walks, and zero earned runs.