Prep Baseball Report

Statistical Breakdown: Burlington & Mooresville Open ID's


Matt Payne
Director of Scouting, PBR of NC

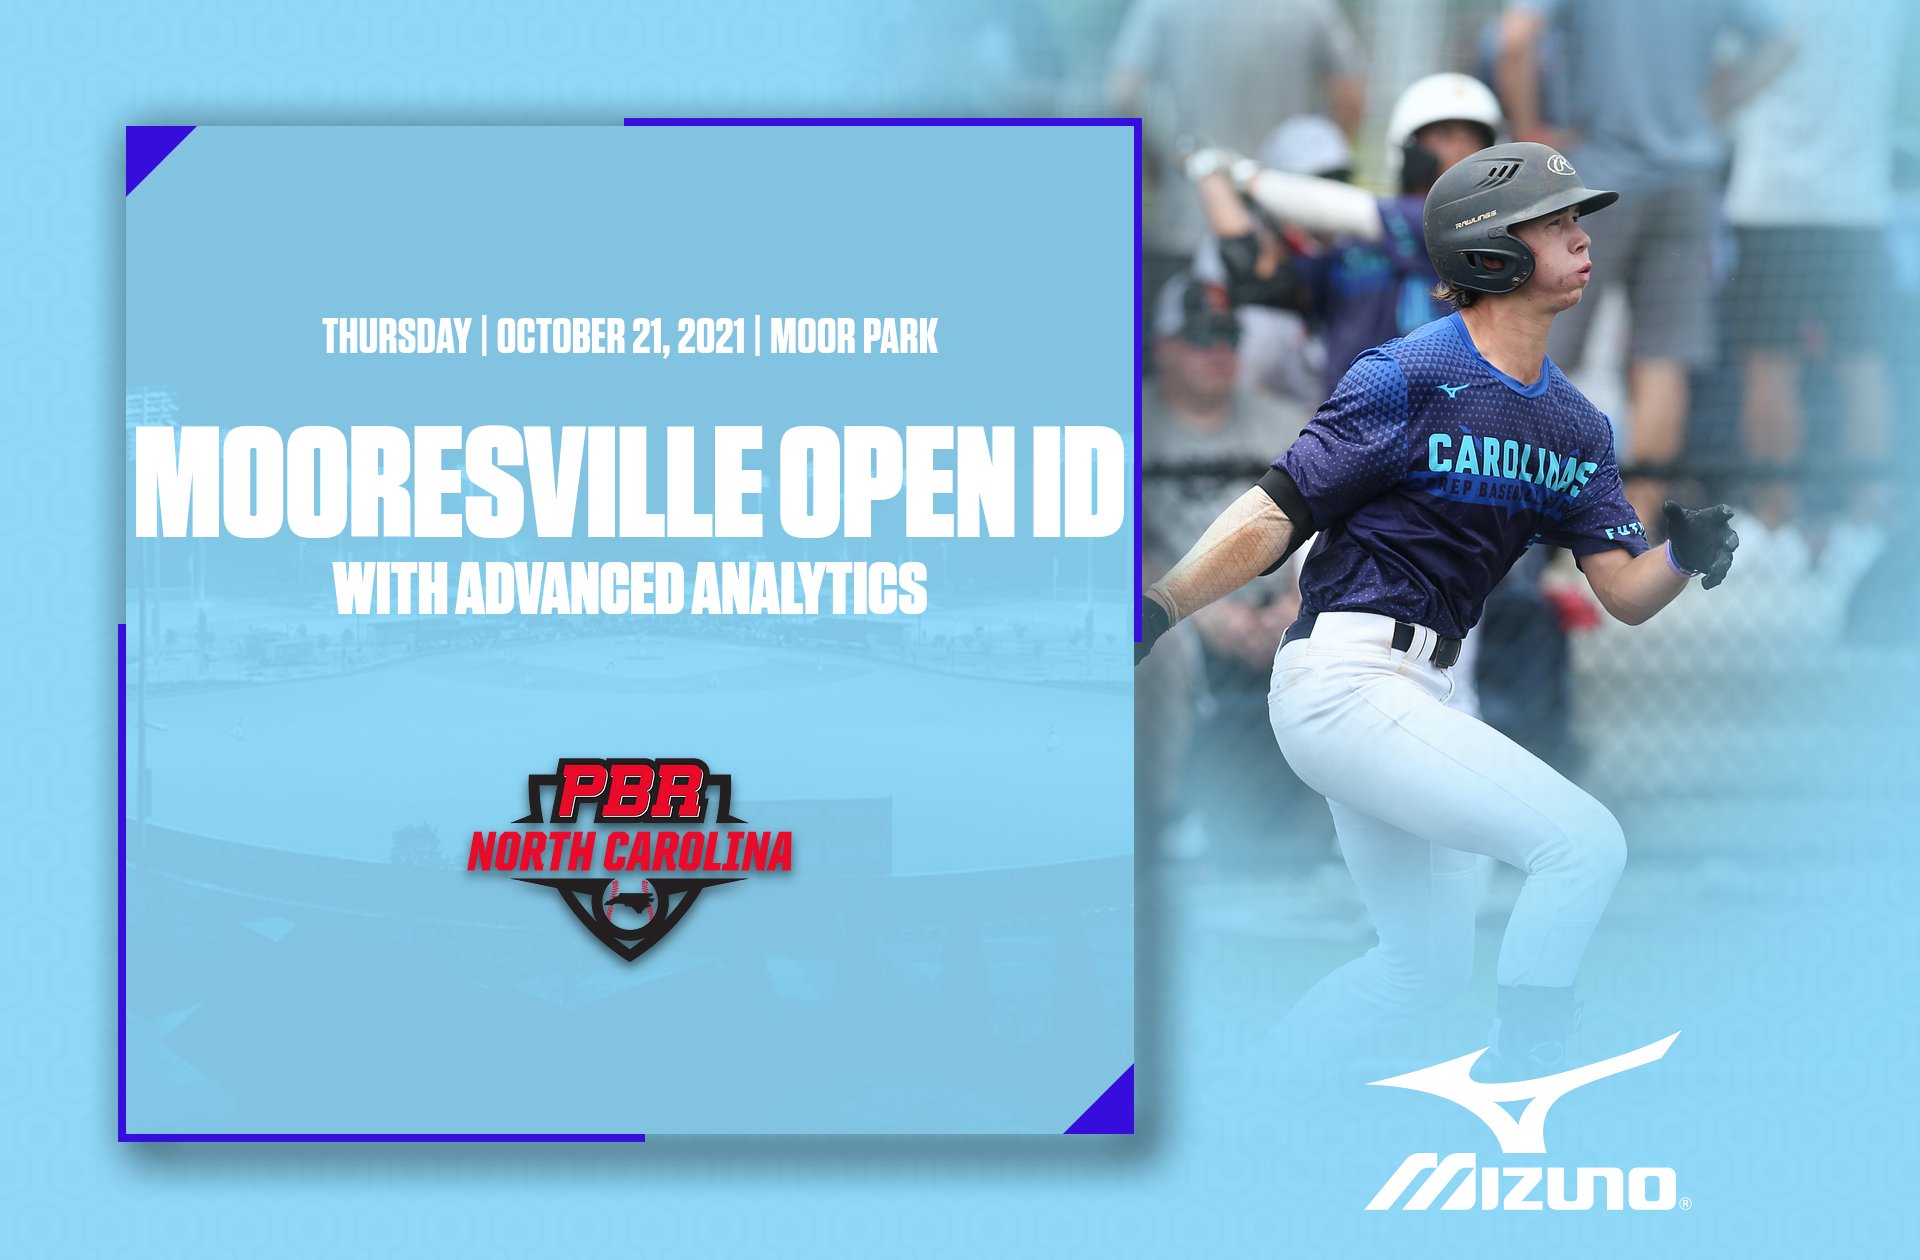
PBR of North Carolina hosted Open ID’s in Burlington, NC on October 20th and Mooresville NC on October 21st. The events featured players from the 2022-2026 grad classes. 

The Open ID’s began with catchers going through their defensive evaluations. PItchers followed by throwing a controlled bullpen with cameras rolling and Trackman collecting ball flight information. When the bullpens were complete, position players ran a laser timed 60, took live batting practice on the field with Trackman gathering ball flight data. The event concluded with outfielders and infielders going through a defensive workout. 

Below we being to break down some of the numbers collected throughout the events with more player information to follow in the coming days. 

CLICK HERE for the full roster and stats from Burlington

CLICK HERE for the full roster and stats from Mooresville

Statistical Leaders

THE 60 YARD DASH

Players ran a laser timed 60 yard dash to start the pro-style workout. The 60's were ran on a natural surface. 

Rank Name State School Class Pos 60-yard
1 Jacob Dilley NC Watauga 2023 C 6.72
2 Connor Peschel NC Fred T Foard 2022 SS 6.87
3 Jackson Berini NC Orange 2023 SS 7.01
4 Collin Robinson NC Cherryville 2023 SS 7.19
^ Ethan Willard NC Trinity 2025 SS 7.19
5 Devyn Campbell NC Olympic 2023 2B 7.33
6 Cameron Neighoff NC Home School 2025 OF 7.34
7 Noah Hatley NC Concord Academy 2025 LHP 7.50
8 Matthew Connolly NC West Rowan 2023 C 7.58
^ Will Fowler NC Cherryville 2023 C 7.58
9 Hayden Furr NC North Stanly 2022 2B 7.64
10 Ian Bailey NC Jordan 2024 1B 7.65

TRACKMAN MAX EXIT VELOCITY (BP)

During BP, TrackMan tracked ball flight off the bat.  One element TrackMan is able to produce is the exit velocity.  Below are the top Exit Velocities produced during live BP.

Rank Name State School Class Pos Exit Velocity (max)
1 Ian Bailey NC Jordan 2024 1B 99.2 mph
2 Jacob Dilley NC Watauga 2023 C 98.3 mph
3 Connor Peschel NC Fred T Foard 2022 SS 95.3 mph
4 Will Fowler NC Cherryville 2023 C 92.7 mph
5 Matthew Connolly NC West Rowan 2023 C 90.4 mph
6 Jorge Torres NC Northern Guilford 2025 MIF 90.0 mph
7 Jake Hansen NC Enloe 2024 1B 89.9 mph
8 CJ Whitaker NC Corinth Holders 2025 C 89.6 mph
9 Devyn Campbell NC Olympic 2023 2B 88.6 mph
10 Jackson Berini NC Orange 2023 SS 88.3 mph

TRACKMAN MAX DISTANCE (BP)

During BP, TrackMan tracked ball flight off the bat.  One element TrackMan is able to produce is the distance each hit travels, if in fair territory.  Below are the top max distances produced during live BP.

Rank Name State School Class Pos Distance (max)
1 Ian Bailey NC Jordan 2024 1B 391 ft
2 Connor Peschel NC Fred T Foard 2022 SS 380 ft
3 Jacob Dilley NC Watauga 2023 C 353 ft
4 Will Fowler NC Cherryville 2023 C 346 ft
5 Jake Hansen NC Enloe 2024 1B 327 ft
6 Jorge Torres NC Northern Guilford 2025 MIF 325 ft
7 Matthew Connolly NC West Rowan 2023 C 322 ft
8 Brett Cassell NC Cox Mill 2024 SS 321 ft
9 Hayden Furr NC North Stanly 2022 2B 317 ft
10 Braden Beyer NC Wakefield 2024 3B 315 ft

POSITIONAL VELOCITY – INFIELDERS

Infielders were able to workout at shortstop throwing across the infield, or from 1B throwing to 2B and 3B in the pro-style workout.  Coaches are working to evaluate rhythm, footwork, hands, exchanges, arm action, accuracy, and carry.  To measure arm strength PBR Scouts utilize a radar gun.  Below are the top posted positional velocities from the day.

Rank Name State School Class Pos INF Velo
1 Jacob Dilley NC Watauga 2023 C 85
2 Devyn Campbell NC Olympic 2023 2B 84
3 Connor Peschel NC Fred T Foard 2022 SS 82
4 Ian Bailey NC Jordan 2024 1B 80
5 Caden Glauber SC Catawba Ridge 2026 RHP 78
6 Jackson Berini NC Orange 2023 SS 77
7 Will Fowler NC Cherryville 2023 C 76
8 Ethan Willard NC Trinity 2025 SS 74
^ Hayden Furr NC North Stanly 2022 2B 74
^ Jorge Torres NC Northern Guilford 2025 MIF 74
9 Brett Cassell NC Cox Mill 2024 SS 73
^ Matthew Connolly NC West Rowan 2023 C 73
10 Collin Robinson NC Cherryville 2023 SS 72

POSITIONAL VELOCITY – OUTFIELDERS

Outfielders worked out from right field, making throws to the plate.  Throws were measured by a radar gun to gauge arm strength.  Scouts are also working to see exchange, arm path, carry, and accuracy.

Rank Name State School Class Pos OF Velo
1 Jacob Dilley NC Watauga 2023 C 88
2 Connor Peschel NC Fred T Foard 2022 SS 79
3 Cameron Neighoff NC Home School 2025 OF 73
4 CJ Whitaker NC Corinth Holders 2025 C 72
5 Noah Hatley NC Concord Academy 2025 LHP 68

CATCHER POP TIMES & POSITIONAL VELOCITY

In the pro-style workout, catchers workout from behind home plate, making multiple throws to 2B, simulating a stolen base attempt.  Scouts again are looking for a quick, clean transition to the release as well as carry and accuracy on the throw.  For catchers, evaluators will put a stopwatch on the “pop time” or the time the ball hits their glove to the time the ball hits the MIF’s glove at 2B.  Coaches can also time the transition from when the ball hits the catchers glove to when he is able to release his throw.  PBR scouts add the radar gun to put a number on the arm strength out of the crouched position.

Rank Name State School Class Pos C Velo
1 Jacob Dilley NC Watauga 2023 C 79
2 Will Fowler NC Cherryville 2023 C 77
3 Matthew Connolly NC West Rowan 2023 C 75
4 Evan Estes NC Cox Mill 2024 C 68
^ CJ Whitaker NC Corinth Holders 2025 C 68
5 Jake Hansen NC Enloe 2024 1B 65
6 Chase Mitchell NC Heritage 2025 2B 57

Rank Name State School Class Pos Pop Time
1 Jacob Dilley NC Watauga 2023 C 1.93-2.08
2 Matthew Connolly NC West Rowan 2023 C 2.01-2.19
3 Will Fowler NC Cherryville 2023 C 2.11-2.19
4 CJ Whitaker NC Corinth Holders 2025 C 2.17-2.33
5 Evan Estes NC Cox Mill 2024 C 2.29-2.48
6 Jake Hansen NC Enloe 2024 1B 2.36-2.49
7 Chase Mitchell NC Heritage 2025 2B 2.69-2.97

TRACKMAN INFO - PITCHER BULLPENS

Pitchers threw a controlled bullpen showcasing their full arsenal of pitches. Velocity and spin rate information was gathered off of the TrackMan. TrackMan analytics are the official analytics and the velocities below were captured by TrackMan.

Max Fastball Velocity

Rank Name State School Class Pos Velocity (max)
1 Ian Bailey NC Jordan 2024 1B 87.3 mph
2 Garrett Brouwer NC Southlake Christian 2022 RHP 80.9 mph
3 Jackson Greene NC William Amos Hough 2023 RHP 80.7 mph
4 Caden Glauber SC Catawba Ridge 2026 RHP 80.5 mph
5 Jorge Torres NC Northern Guilford 2025 MIF 79.4 mph
6 Justin Willis SC Clover 2022 RHP 78.7 mph
7 Cole Hansen NC Enloe 2022 RHP 77.4 mph
8 Cameron Neighoff NC Home School 2025 OF 73.8 mph
9 Noah Hatley NC Concord Academy 2025 LHP 70.8 mph

Max Fastball Spin Rate

Rank Name State School Class Pos Spin Rate (max)
1 Ian Bailey NC Jordan 2024 1B 2362 rpm
2 Garrett Brouwer NC Southlake Christian 2022 RHP 2252 rpm
3 Caden Glauber SC Catawba Ridge 2026 RHP 2225 rpm
4 Justin Willis SC Clover 2022 RHP 2168 rpm
5 Cole Hansen NC Enloe 2022 RHP 2132 rpm
6 Jackson Greene NC William Amos Hough 2023 RHP 1901 rpm
7 Cameron Neighoff NC Home School 2025 OF 1809 rpm
8 Jorge Torres NC Northern Guilford 2025 MIF 1685 rpm
9 Noah Hatley NC Concord Academy 2025 LHP 1608 rpm

Max Curveball Spin Rate

Rank Name State School Class Pos Spin Rate (max)
1 Garrett Brouwer NC Southlake Christian 2022 RHP 2313 rpm
2 Justin Willis SC Clover 2022 RHP 2251 rpm
3 Caden Glauber SC Catawba Ridge 2026 RHP 2094 rpm
4 Cole Hansen NC Enloe 2022 RHP 2091 rpm
5 Cameron Neighoff NC Home School 2025 OF 2059 rpm
6 Jackson Greene NC William Amos Hough 2023 RHP 2012 rpm
7 Noah Hatley NC Concord Academy 2025 LHP 1681 rpm
8 Jorge Torres NC Northern Guilford 2025 MIF 1654 rpm