Prep Baseball Report

Top Underclass Games: TrackMan Offensive Leaders


Brandon Hall
Mid-Atlantic Scouting Director

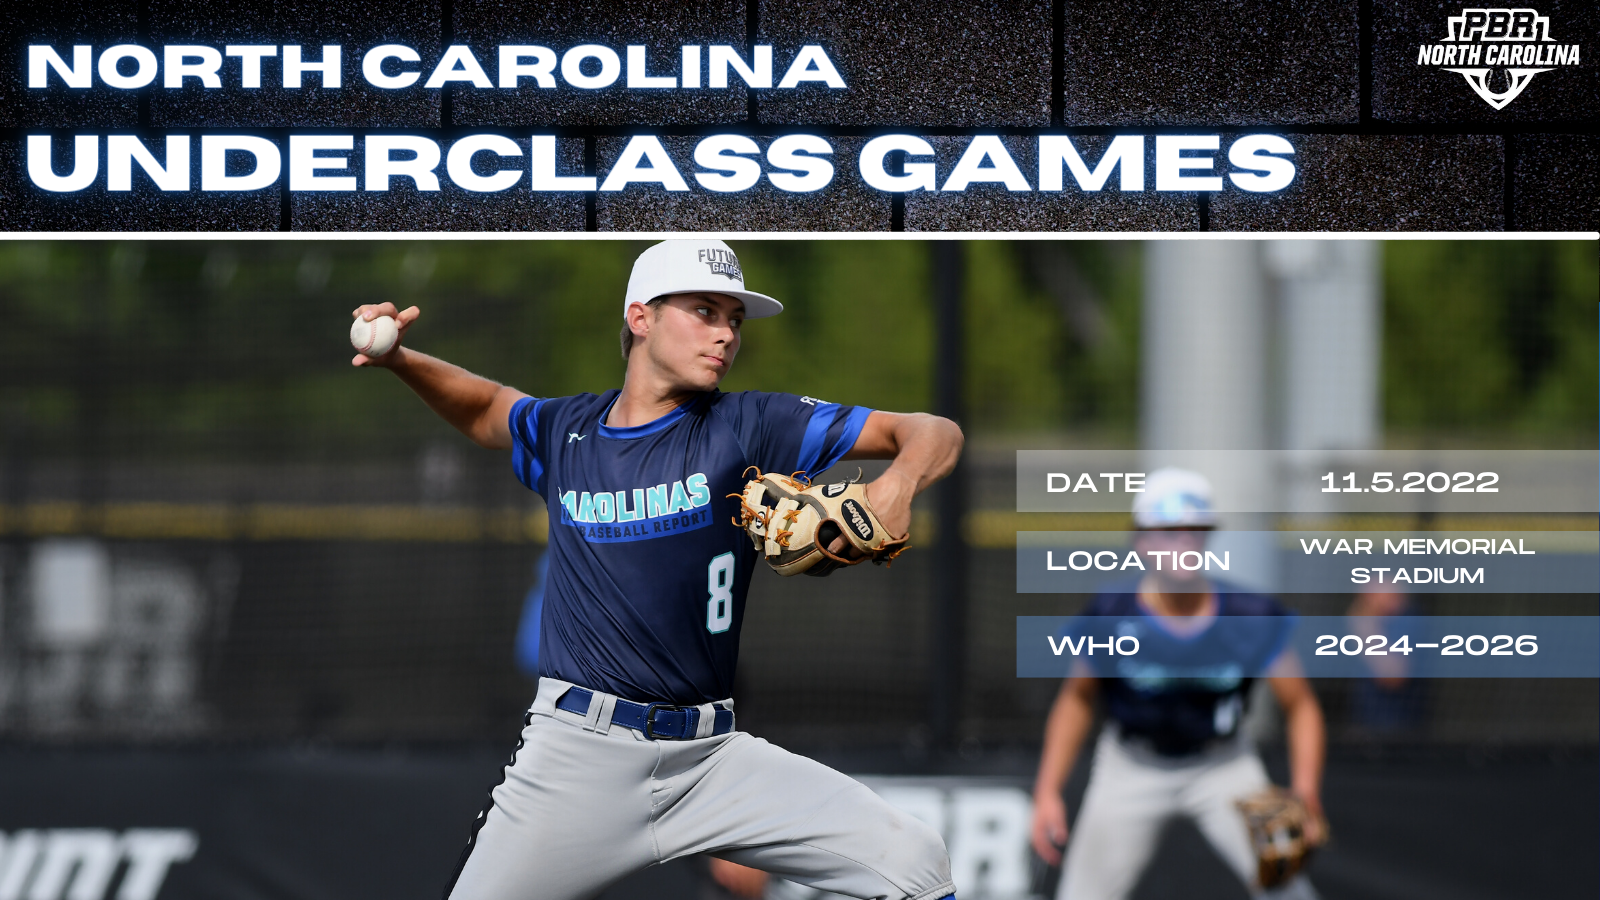
On Saturday November 5th PBR of North Carolina hosted its Underclass Games at War Memorial Stadium in Greensboro, NC. The invite only event featured some of the top players from across North Carolina in the 2024-2026 grad classes. 

The day began with position players running a laser timed 10yd and 60 yd sprint. After running position players took batting practice on the field with Trackman collecting ball flight data and Blast collecting swing information. Following batting practice position players went through a defensive evaluation. After the pro-style workout position players were split into two teams and played two controlled scrimmage games facing live arms. During the games Trackman was used to gather data on each pitcher. 

Below we begin our breakdown of the talented roster in attendance. Look for more information to follow in the coming days.

Click Here to see full roster and stats


Trackman Offensive Leaders
 

PEAK EXIT VELOCITY

TrackMan is able to track every ball hit into fair territory, throughout the BP sessions.  Below are the exit velocities produced by individual players.

Rank Name State School Class Pos Exit Velocity (max)
1 Dylan Pasternak NC Leesville Road 2024 SS 92.8 mph
2 Cameron Brown NC North Raleigh Christian 2024 RHP 92.5 mph
3 Nico Soul NC Marvin Ridge 2025 OF 92.3 mph
4 Cade Gardner NC A.C. Reynolds 2024 SS 91.1 mph
5 Jake Dunlap NC High Point Christian 2024 OF 91.0 mph
6 Ayden Wall NC Ledford 2025 C 90.6 mph
7 Clay Rosser NC Grimsley 2025 RHP 89.5 mph
8 Sam Zalinsky NC Weddington 2025 SS 89.0 mph
9 Jentz Steiner NC Apex Friendship 2024 3B 88.3 mph
10 Matt McKnight NC Pro Stock Royals Academy 2025 3B 88.2 mph


AVERAGE EXIT VELOCITY

The average exit velocity measures a players ability to consistently produce hard contact.  The average was taken based on every ball tracked by TrackMan throughout the player's BP session.

Rank Name State School Class Pos Exit Velocity (avg)
1 Jake Dunlap NC High Point Christian 2024 OF 87.2 mph
2 Nico Soul NC Marvin Ridge 2025 OF 86.4 mph
3 Dylan Pasternak NC Leesville Road 2024 SS 85.7 mph
4 Cade Gardner NC A.C. Reynolds 2024 SS 85.2 mph
5 Cameron Brown NC North Raleigh Christian 2024 RHP 84.9 mph
6 Ayden Wall NC Ledford 2025 C 83.0 mph
7 Jack McKellar NC Rocky Mount 2026 C 82.1 mph
8 Jentz Steiner NC Apex Friendship 2024 3B 82.0 mph
9 Matt McKnight NC Pro Stock Royals Academy 2025 3B 80.5 mph
10 Austin Price NC Covenant Day 2025 OF 80.5 mph


DISTANCE OFF THE BAT


TrackMan is able to measure and track the ball while in the air.  For every fair ball put in play it will display the distance the hit traveled.


Peak Distance - Best of the Hitter’s Session


Rank Name State School Class Pos Distance (max)
1 Nico Soul NC Marvin Ridge 2025 OF 351 ft
2 Cameron Brown NC North Raleigh Christian 2024 RHP 339 ft
3 Jack McKellar NC Rocky Mount 2026 C 326 ft
4 Jake Dunlap NC High Point Christian 2024 OF 323 ft
5 Dylan Pasternak NC Leesville Road 2024 SS 319 ft
6 Sam Zalinsky NC Weddington 2025 SS 315 ft
7 CJ Whitaker NC Corinth Holders 2025 C 310 ft
8 Bo Nichols NC West Wilkes 2024 1B 307 ft
9 Hayden Ashby NC Cox Mill 2024 1B 306 ft
10 Tucker Payton NC South Point 2026 SS 306 ft


Average Distance - Average of each ball tracked in the Session


Rank Name State School Class Pos Distance (avg)
1 Cameron Brown NC North Raleigh Christian 2024 RHP 258 ft
2 Grayson Hudgins NC Pinecrest 2024 1B 243 ft
3 Jadden Rodriguez NC Ledford North Carolina 2023 OF 234 ft
4 Tucker Payton NC South Point 2026 SS 232 ft
5 Ayden Wall NC Ledford 2025 C 230 ft
6 Nico Soul NC Marvin Ridge 2025 OF 224 ft
7 Carlos Diaz NC Wake Forest 2025 C 221 ft
8 Jack McKellar NC Rocky Mount 2026 C 214 ft
9 Jake Dunlap NC High Point Christian 2024 OF 211 ft
10 Bo Nichols NC West Wilkes 2024 1B 211 ft


HARD HIT PERCENTAGE

TrackMan is able to track and follow exit velocities of each hitter.  Based on the individual's top exit velocity, TrackMan is able to give us a percentage of hard hit balls.  This percentage is based off of each individual hitter's top exit velocity.

Rank Name State School Class Pos Hard Hit %
1 Nico Soul NC Marvin Ridge 2025 OF 55 %
2 Dylan Pasternak NC Leesville Road 2024 SS 30 %
3 Cameron Brown NC North Raleigh Christian 2024 RHP 25 %
4 Cade Gardner NC A.C. Reynolds 2024 SS 22 %
5 Jake Dunlap NC High Point Christian 2024 OF 14 %
6 Ayden Wall NC Ledford 2025 C 12 %


LAUNCH ANGLE PERCENTAGE

Based on the ball flight, TrackMan is able to identify each hit as a ground ball, line drive, or fly ball.  While there are many factors as to why a hitter may approach each pitch in a certain way, the overall groupings of BP can give some insight to each hitter's approach.

Line Drive %


Rank Name State School Class Pos Line Drive %
1 Ayden Broughton NC Pamlico County 2026 3B 77 %
2 Michael Woodard NC New Bern 2026 1B 71 %
^ Jack McKellar NC Rocky Mount 2026 C 71 %
3 Austin Price NC Covenant Day 2025 OF 66 %
4 Bo Nichols NC West Wilkes 2024 1B 63 %
5 Cameron Brown NC North Raleigh Christian 2024 RHP 62 %


Fly Ball %


Rank Name State School Class Pos Fly Ball %
1 Tucker Payton NC South Point 2026 SS 71.4 %
2 Grayson Hudgins NC Pinecrest 2024 1B 66.7 %
3 Jadden Rodriguez NC Ledford North Carolina 2023 OF 57.1 %
4 Caden Reedy NC Oak Grove 2026 C 54.5 %
5 Carlos Diaz NC Wake Forest 2025 C 40.0 %


Ground Ball %


Rank Name State School Class Pos Ground Ball %
1 Tanner Brewer NC Northwest Guilford 2024 OF 54 %
2 Clay Rosser NC Grimsley 2025 RHP 52 %
3 CJ Whitaker NC Corinth Holders 2025 C 50 %
4 Hayden Ashby NC Cox Mill 2024 1B 44 %
5 Brady Williams NC Currituck County 2024 2B 42 %