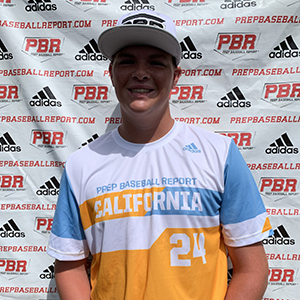
CLASS OF 2023
1B
RHP
MJ
Sweeney
Texas
St. Augustine (HS) • CA
6' 7" • 245LBS
L/R • 20yr 4mo
Travel Team: CBA
St. Augustine (HS) • CA
6' 7" • 245LBS
L/R • 20yr 4mo
Travel Team: CBA
Rankings
2023 National
Rankings available to Premium Subscriber
2023 State
Rankings available to Premium Subscriber
Commitment
Best Of Stats
23.5
Hand Speed (max)
7/28/21
76.5
Bat Speed (max)
7/28/21
20.3
Rot. Acc (max)
7/28/21
-
Hard Hit %
97.6
Exit Velocity (max)
7/28/21
87.1
Exit Velocity (avg)
7/28/21
344
Distance (max)
8/01/20
42
Sweet Spot %
7/28/21
7.83
60
7/28/21
-
30-yd
-
10-yd
-
Run speed (max)
81
INF Velo
7/28/21
-
OF Velo
-
C Velo
-
Pop Time
Fastball
85
Velocity (max)
7/28/21
82 - 85
Velo Range
7/28/21
-
Spin Rate (avg)
Curveball
71 - 72
Velo Range
7/28/21
-
Spin Rate (avg)
Slider
68 - 70
Velo Range
8/01/20
-
Spin Rate (avg)
Positional Tools
2021
2020
60 Yard Dash
The athlete's fastest 60-yard dash time in the given event year. Measured in seconds (s)
7.83
Infield Velocity
The athlete's maximum throwing velocity from an infield position in the given event year. Measured in miles per hour (MPH).
81.0
Power / Speed Score
A simple calculation that divides the athlete’s Exit Velocity Max by the athlete’s 60 Yard Dash time for the given event year. For example, 98 MPH / 7.00s = 14.00.
12.5
60 Yard Dash
The athlete's fastest 60-yard dash time in the given event year. Measured in seconds (s)
8.10
Infield Velocity
The athlete's maximum throwing velocity from an infield position in the given event year. Measured in miles per hour (MPH).
77.0
Power / Speed Score
A simple calculation that divides the athlete’s Exit Velocity Max by the athlete’s 60 Yard Dash time for the given event year. For example, 98 MPH / 7.00s = 14.00.
11.2
Hitting

2021
2020
Exit Velocity Max
The highest exit velocity of any batted ball in the given event year. Measured in miles per hour (MPH).
97.6
Exit Velocity Avg
Average exit velocity of all batted balls in the given event year. Measured in miles per hour (MPH).
87.1
Distance Max
The highest flight distance of any batted ball in the given event year. Measured in feet (ft).
344
Distance Avg
Average flight distance of all batted balls in the given event year. Measured in feet (ft).
271
Launch Angle Avg
Average launch angle of all batted balls in the given event year. Measured in degrees.
35.0
Hard Hit %
Percentage of batted balls with exit velocities over 95 MPH in the given event year.
Sweet Spot %
Percentage of batted balls in the given event year with a launch angle between 8° and 32°.
Line Drive %
Percentage of batted balls with launch angles between 10 and 25 degrees in the given event year.
Fly Ball %
Percentage of batted balls with launch angles between 25 and 50 degrees in the given event year.
Ground Ball %
Percentage of batted balls with launch angles below 10 degrees in the given event year.
Exit Velocity Max
The highest exit velocity of any batted ball in the given event year. Measured in miles per hour (MPH).
90.4
Exit Velocity Avg
Average exit velocity of all batted balls in the given event year. Measured in miles per hour (MPH).
78.2
Distance Max
The highest flight distance of any batted ball in the given event year. Measured in feet (ft).
344
Distance Avg
Average flight distance of all batted balls in the given event year. Measured in feet (ft).
245
Launch Angle Avg
Average launch angle of all batted balls in the given event year. Measured in degrees.
34.6
Hard Hit %
Percentage of batted balls with exit velocities over 95 MPH in the given event year.
Sweet Spot %
Percentage of batted balls in the given event year with a launch angle between 8° and 32°.
Line Drive %
Percentage of batted balls with launch angles between 10 and 25 degrees in the given event year.
Fly Ball %
Percentage of batted balls with launch angles between 25 and 50 degrees in the given event year.
Ground Ball %
Percentage of batted balls with launch angles below 10 degrees in the given event year.
2021 Future Games
Jul 28, 2021
Trackman - Hitting
97.6
Exit Velocity (max)
87.1
Exit Velocity (avg)
271
Distance (avg)
344
Distance (max)
Hard Hit %
Sweet Spot %
Line Drive %
Fly Ball %
AZ/CA/MV/PNW Workout Pod
Jul 28, 2021
Trackman - Hitting
97.6
Exit Velocity (max)
87.1
Exit Velocity (avg)
271
Distance (avg)
344
Distance (max)
Hard Hit %
Sweet Spot %
Line Drive %
Fly Ball %
Future Games Showcase (AZ, CA, NV, PNW)
Aug 1, 2020
Trackman - Hitting
90.4
Exit Velocity (max)
78.2
Exit Velocity (avg)
245
Distance (avg)
344
Distance (max)
Hard Hit %
Sweet Spot %
Line Drive %
Fly Ball %
Ground Ball %
Hitting

2021
2020
Hand Speed Max
The highest Peak Hand Speed of any swing in the given event year.
23.5
Hand Speed Avg
The average Peak Hand Speed for all swings in the given event year.
22.5
Bat Speed Max
The highest Bat Speed of any swing in the given event year.
76.5
Bat Speed Avg
The average Bat Speed for all swings in the given event year.
73.7
Rotational Acceleration Max
The highest Rotational Acceleration of any swing in the given event year.
Rotational Acceleration Avg
The average Rotational Acceleration for all swings in the given event year.
On-Plane Efficiency Max
The highest On-Plane Efficiency of any swing in the given event year.
On-Plane Efficiency Avg
The average On-Plane Efficiency for all swings in the given event year.
Hand Speed Max
The highest Peak Hand Speed of any swing in the given event year.
22.7
Hand Speed Avg
The average Peak Hand Speed for all swings in the given event year.
21.8
Bat Speed Max
The highest Bat Speed of any swing in the given event year.
71.2
Bat Speed Avg
The average Bat Speed for all swings in the given event year.
68.5
Rotational Acceleration Max
The highest Rotational Acceleration of any swing in the given event year.
Rotational Acceleration Avg
The average Rotational Acceleration for all swings in the given event year.
On-Plane Efficiency Max
The highest On-Plane Efficiency of any swing in the given event year.
On-Plane Efficiency Avg
The average On-Plane Efficiency for all swings in the given event year.
AZ/CA/MV/PNW Workout Pod
Jul 28, 2021
Blast - Hitting
23.5
Hand Speed (max)
22.5
Hand Speed (avg)
76.5
Bat Speed (max)
73.7
Bat Speed (avg)
Rot. Acc (max)
Rot. Acc (avg)
On Plane Eff (avg)
2021 Future Games
Jul 28, 2021
Blast - Hitting
23.5
Hand Speed (max)
22.5
Hand Speed (avg)
76.5
Bat Speed (max)
73.7
Bat Speed (avg)
Rot. Acc (max)
Rot. Acc (avg)
On Plane Eff (avg)
MaxOnPlaneEfficiency
California State Games
Aug 14, 2020
Blast - Hitting
22.7
Hand Speed (max)
21.8
Hand Speed (avg)
71.2
Bat Speed (max)
68.5
Bat Speed (avg)
Rot. Acc (max)
Rot. Acc (avg)
On Plane Eff (avg)
MaxOnPlaneEfficiency
Future Games Showcase (AZ, CA, NV, PNW)
Aug 1, 2020
Blast - Hitting
23.9
Hand Speed (max)
22.9
Hand Speed (avg)
77.4
Bat Speed (max)
67.8
Bat Speed (avg)
Rot. Acc (max)
Rot. Acc (avg)
On Plane Eff (avg)
Pitching

2021
Fastball
Velocity Max
The maximum observed fastball velocity in the given event year. Measured in miles per hour (MPH).
85.5
Fastball
Velocity Avg
The average velocity for all pitches of this type in the given event year. Measured in miles per hour (MPH).
84.3
Fastball
Spin Rate Avg
The average rate of spin for all pitches of this type in the given event year. Measured in rotations per minute (RPM).
1551
Fastball
Spin Score Avg
The average Bauer Units value of all fastballs in the given event year. Bauer Units are calculated for each pitch by dividing Spin Rate by Velocity.
18.4
Curveball
Velocity Avg
The average velocity for all pitches of this type in the given event year. Measured in miles per hour (MPH).
72.0
Curveball
Spin Rate Avg
The average rate of spin for all pitches of this type in the given event year. Measured in rotations per minute (RPM).
1583
2021 Future Games
Jul 28, 2021
Trackman - Fastball
85.5
Velocity (max)
83.2 - 85.5
Velo Range
82.9
Eff Velocity (avg)
1,722
Spin Rate (max)
1,551
Spin Rate (avg)
Spin Score (max)
Trackman - Curveball
72.0
Velocity (max)
71.3
Eff Velocity (avg)
1,583
Spin Rate (max)
1,583
Spin Rate (avg)
Spin Score (max)
Pitch Scores
Pitching Velos
2021
2020
Fastball
Velocity Max
The maximum observed fastball velocity in the given event year. Measured in miles per hour (MPH).
85.0
Fastball
Velocity Avg
The average velocity for all pitches of this type in the given event year. Measured in miles per hour (MPH)
82.8
Curveball
Velocity Avg
The average velocity for all pitches of this type in the given event year. Measured in miles per hour (MPH)
71.5
Fastball
Velocity Max
The maximum observed fastball velocity in the given event year. Measured in miles per hour (MPH).
82.0
Fastball
Velocity Avg
The average velocity for all pitches of this type in the given event year. Measured in miles per hour (MPH)
81.0
Slider
Velocity Avg
The average velocity for all pitches of this type in the given event year. Measured in miles per hour (MPH)
69.0
Game Performance

Visual Edge

2021
Edge Score
The highest Edge Score within the given year. Edge Score is a comprehensive score that takes the core-six visual skills into account, providing an assessment of an athlete’s overall visual ability.
58.96
Pitch Ai

2021
Arm Speed
The maximum speed, in the direction of home plate, that the wrist is traveling. Measured in meters per second (m/s)
Knee Extension Velo
The angular velocity of the front knee straightening after foot plant, which provides indicators of velocity potential. Measured in degrees per second.
Deception
The amount of time that the ball is visible to the hitter, after the instant of front foot strike. Measures in milliseconds.
Hip-Shoulder Separation
The difference in angle of between the hips and shoulders, occurring close to the foot plant. Measured in degrees.
AZ/CA/MV/PNW Workout Pod
Jul 28, 2021
ProPlayAI - Foot Plant
Elbow Flexion (avg)
Shoulder Abduction (avg)
Hip Shoulder Seperation (avg)
ProPlayAI - MER
External Rotation (avg)
Stride Length (avg)
Horizontal Abduction (avg)
ProPlayAI - Release
Arm Speed (max)
Arm Speed (avg)
Knee Extension Velocity (max)
Knee Extension Velocity (avg)
Knee Flexion (avg)
Lateral Trunk Tilt (avg)
Arm Path (avg)
Deception (avg)
Torque (avg)
Efficiency (avg)
Sequencing (avg)
2021 Future Games
Jul 28, 2021
ProPlayAI - Foot Plant
Elbow Flexion (avg)
Shoulder Abduction (avg)
Hip Shoulder Seperation (avg)
ProPlayAI - MER
External Rotation (avg)
Stride Length (avg)
Horizontal Abduction (avg)
ProPlayAI - Release
Arm Speed (max)
Arm Speed (avg)
Knee Extension Velocity (max)
Knee Extension Velocity (avg)
Knee Flexion (avg)
Lateral Trunk Tilt (avg)
Arm Path (avg)
Deception (avg)
Torque (avg)
Efficiency (avg)
Sequencing (avg)
Notes
News
- 2023 Team Preview: St. Augustine Saints - Feb 17, 2023
- Creekside Summer Championships (6/16-6/19): Scout Blog - Jun 18, 2022
- Spring Tourney Notebook - May 2, 2022
- San Diego Swing: 23 for 2023 - Dec 20, 2021
- 2021 Future Games: College Commitment Tracker - Aug 3, 2021
- Team CA Future Games: Day 3 Recap - Jul 30, 2021
- Team California Roster - Jul 25, 2021
- San Diego Swing: Midseason Review - Apr 26, 2021
- California State Games: 2023 Uncommitted - Sep 17, 2020
- California State Games: Grey Team Analysis Part 2 - Sep 10, 2020
- STATE GAMES BLAST MOTION LEADERBOARD: PEAK HAND SPEED - Aug 27, 2020
- FUTURE GAMES: BLAST MOTION LEADERBOARD - ON PLANE EFFICIENCY - Aug 18, 2020
- FUTURE GAMES: BLAST MOTION LEADERBOARD - POWER - Aug 12, 2020
- FUTURE GAMES: BLAST MOTION LEADERBOARD - BAT SPEED - Aug 11, 2020
- FUTURE GAMES: BLAST MOTION LEADERBOARD - ROTATIONAL ACCELERATION - Aug 11, 2020
- Team California - Future Games - Stat Analysis - Aug 1, 2020
- San Diego Swing: 25 Uncommitted Players to Watch - Feb 14, 2020
- San Diego Swing: MLK 2020 - Jan 27, 2020
Comments
Draft Reports
Contact
Premium Content Area
To unlock contact information, you need to purchase a ScoutPLUS subscription.
Purchase Subscription OR
Login


 Sign in to view rankings
CA STATE GAMES:
Positional Profile: 1B/RHP
Body: 6-6, 235-pounds. Large and lengthy body with a sturdy frame.
Hit: LHH. Stands tall and slightly bent at the knees. Hands are neutral behind the ear. Smaller leg lift trigger. Starts movements early. The swing plane is flat, barrel stays in the zone a long time and stays extended through finish. Good plate coverage.
Power: 90 mph exit velocity from the tee. Above average bat speed (69mph) and rotational acceleration (17 g's) for his level per Blast Motion data. Plus pull side power. Over the wall power is coming soon.
Arm: RH. INF - 77 mph. Shorter and whippy arm action on DPs and longer arm action on throws to third. Slower out of the glove but sets up his feet well to make mostly accurate throws.
Defense: Takes good first steps and is instinctual. Heavier feet but good footwork. Fields everything centered.
Run: 8.10 runner in the 60.
Saints 2023 uncommitted first-basemen MJ Sweeney is hard to miss at 6-foot-7 235 pounds. The son of former big leaguer Mike Sweeney had a nice game Saturday collecting a line-drive single and towering double, both to the pull side. Hitting mechanics are relatively simple for a big guy with overall early timing mechanisms to enable him to keep his long and extended on-plane swing through the zone for an extended period of time. Athletically is raw and needs help with base running but shows some positive actions that are also being utilized on the football field as a left-tackle. Should find himself receiving big at-bats in a potent Saints line-up this coming season. Highly projectable frame, power capability and baseball bloodline project well for the young first-baseman.