CLASS OF 2024
RHP
OF
Montrell
Christian Jr
Georgia State
Forest Park (HS) • GA
6' 4" • 225LBS
R/R • 18yr 9mo
Travel Team: Carolina White Sox
Forest Park (HS) • GA
6' 4" • 225LBS
R/R • 18yr 9mo
Travel Team: Carolina White Sox
Rankings
2024 National
Rankings available to Premium Subscriber
2024 State
Rankings available to Premium Subscriber
Commitment
Best Of Stats

Fastball
88.4
Velocity (max)
7/27/22
83.6 - 86.2
Velo Range
6/09/21
2089
Spin Rate (avg)
6/09/21
Changeup
79.9 - 80.4
Velo Range
7/27/22
1669
Spin Rate (avg)
7/27/22
Curveball
66 - 73
Velo Range
1/10/21
1904
Spin Rate (avg)
1/10/21

93.6
Exit Velocity (max)
6/09/21
79.4
Exit Velocity (avg)
6/09/21
327
Distance (max)
6/09/21
78
Sweet Spot %
6/09/21

24.7
Hand Speed (max)
1/10/21
76.7
Bat Speed (max)
1/10/21
13.3
Rot. Acc (max)
1/10/21
22
Hard Hit %
6/09/21

7.09
60-yd
1/10/21
-
30-yd
-
10-yd
-
Run speed (max)

85
INF Velo
6/09/21
86
OF Velo
1/10/21
-
C Velo
-
Pop Time
Positional Tools
2021
60 Yard Dash
The athlete's fastest 60-yard dash time in the given event year. Measured in seconds (s)
7.09
Infield Velocity
The athlete's maximum throwing velocity from an infield position in the given event year. Measured in miles per hour (MPH).
85.0
Outfield Velocity
The athlete's maximum throwing velocity from an outfield position in the given event year. Measured in miles per hour (MPH).
86.0
Power / Speed Score
A simple calculation that divides the athlete’s Exit Velocity Max by the athlete’s 60 Yard Dash time for the given event year. For example, 98 MPH / 7.00s = 14.00.
13.2
Hitting

2021
Exit Velocity Max
The highest exit velocity of any batted ball in the given event year. Measured in miles per hour (MPH).
93.6
Exit Velocity Avg
Average exit velocity of all batted balls in the given event year. Measured in miles per hour (MPH).
75.6
Distance Max
The highest flight distance of any batted ball in the given event year. Measured in feet (ft).
327
Distance Avg
Average flight distance of all batted balls in the given event year. Measured in feet (ft).
223
Launch Angle Avg
Average launch angle of all batted balls in the given event year. Measured in degrees.
26.8
Hard Hit %
Percentage of batted balls with exit velocities over 95 MPH in the given event year.
Sweet Spot %
Percentage of batted balls in the given event year with a launch angle between 8° and 32°.
Line Drive %
Percentage of batted balls with launch angles between 10 and 25 degrees in the given event year.
Fly Ball %
Percentage of batted balls with launch angles between 25 and 50 degrees in the given event year.
Ground Ball %
Percentage of batted balls with launch angles below 10 degrees in the given event year.
2021 Underclass Games (Invite Only)
Jun 9, 2021
Trackman - Hitting
93.6
Exit Velocity (max)
79.4
Exit Velocity (avg)
236
Distance (avg)
327
Distance (max)
Hard Hit %
Sweet Spot %
Line Drive %
Fly Ball %
Ground Ball %
Underclass Invitational (Invite Only)
Jan 10, 2021
Trackman - Hitting
88.6
Exit Velocity (max)
73.0
Exit Velocity (avg)
214
Distance (avg)
293
Distance (max)
Sweet Spot %
Line Drive %
Fly Ball %
Ground Ball %
Hitting

2021
Hand Speed Max
The highest Peak Hand Speed of any swing in the given event year.
24.7
Hand Speed Avg
The average Peak Hand Speed for all swings in the given event year.
22.4
Bat Speed Max
The highest Bat Speed of any swing in the given event year.
76.7
Bat Speed Avg
The average Bat Speed for all swings in the given event year.
71.7
Rotational Acceleration Max
The highest Rotational Acceleration of any swing in the given event year.
Rotational Acceleration Avg
The average Rotational Acceleration for all swings in the given event year.
On-Plane Efficiency Max
The highest On-Plane Efficiency of any swing in the given event year.
On-Plane Efficiency Avg
The average On-Plane Efficiency for all swings in the given event year.
2021 Underclass Games (Invite Only)
Jun 9, 2021
Blast - Hitting
22.9
Hand Speed (max)
21.4
Hand Speed (avg)
72.6
Bat Speed (max)
69.9
Bat Speed (avg)
Rot. Acc (max)
Rot. Acc (avg)
On Plane Eff (avg)
MaxOnPlaneEfficiency
Underclass Invitational (Invite Only)
Jan 10, 2021
Blast - Hitting
24.7
Hand Speed (max)
23.1
Hand Speed (avg)
76.7
Bat Speed (max)
73.0
Bat Speed (avg)
Rot. Acc (max)
Rot. Acc (avg)
On Plane Eff (avg)
MaxOnPlaneEfficiency
Pitching

2022
2021
Fastball
Velocity Max
The maximum observed fastball velocity in the given event year. Measured in miles per hour (MPH).
88.4
Fastball
Velocity Avg
The average velocity for all pitches of this type in the given event year. Measured in miles per hour (MPH).
84.7
Fastball
Spin Rate Avg
The average rate of spin for all pitches of this type in the given event year. Measured in rotations per minute (RPM).
1951
Fastball
Spin Score Avg
The average Bauer Units value of all fastballs in the given event year. Bauer Units are calculated for each pitch by dividing Spin Rate by Velocity.
23.0
Curveball
Velocity Avg
The average velocity for all pitches of this type in the given event year. Measured in miles per hour (MPH).
68.5
Curveball
Spin Rate Avg
The average rate of spin for all pitches of this type in the given event year. Measured in rotations per minute (RPM).
1859
Changeup
Velocity Avg
The average velocity for all pitches of this type in the given event year. Measured in miles per hour (MPH).
80.2
Changeup
Spin Rate Avg
The average rate of spin for all pitches of this type in the given event year. Measured in rotations per minute (RPM).
1669
Fastball
Velocity Max
The maximum observed fastball velocity in the given event year. Measured in miles per hour (MPH).
86.5
Fastball
Velocity Avg
The average velocity for all pitches of this type in the given event year. Measured in miles per hour (MPH).
83.9
Fastball
Spin Rate Avg
The average rate of spin for all pitches of this type in the given event year. Measured in rotations per minute (RPM).
2069
Fastball
Spin Score Avg
The average Bauer Units value of all fastballs in the given event year. Bauer Units are calculated for each pitch by dividing Spin Rate by Velocity.
24.7
Fastball
Total Movement Avg
The average total non-gravity movement for all pitches of this type in the given event year. Measured in inches (in).
Curveball
Velocity Avg
The average velocity for all pitches of this type in the given event year. Measured in miles per hour (MPH).
67.0
Curveball
Spin Rate Avg
The average rate of spin for all pitches of this type in the given event year. Measured in rotations per minute (RPM).
1848
Curveball
Total Movement Avg
The average total non-gravity movement for all pitches of this type in the given event year. Measured in inches (in).
2022 PBR Future Games
Jul 27, 2022
Trackman - Fastball
88.4
Velocity (max)
83.2 - 86.2
Velo Range
82.4
Eff Velocity (avg)
2,129
Spin Rate (max)
1,951
Spin Rate (avg)
Spin Score (max)
Trackman - Curveball
69.8
Velocity (max)
66.8 - 69.8
Velo Range
66.1
Eff Velocity (avg)
1,939
Spin Rate (max)
1,859
Spin Rate (avg)
Spin Score (max)
Trackman - ChangeUp
80.4
Velocity (max)
79.9 - 80.4
Velo Range
77.6
Eff Velocity (avg)
1,699
Spin Rate (max)
1,669
Spin Rate (avg)
Spin Score (max)
2021 Underclass Games (Invite Only)
Jun 9, 2021
Trackman - Fastball
86.5
Velocity (max)
83.6 - 86.2
Velo Range
83.7
Eff Velocity (avg)
2,187
Spin Rate (max)
2,089
Spin Rate (avg)
IVB (max)
IVB (avg)
HM (max)
HM (avg)
Extension (avg)
Release Ht (avg)
Spin Score (max)
Zone %
Trackman - Curveball
65.9
Velocity (max)
63.8 - 65.6
Velo Range
62.5
Eff Velocity (avg)
1,780
Spin Rate (max)
1,760
Spin Rate (avg)
IVB (max)
IVB (avg)
HM (max)
HM (avg)
Extension (avg)
Release Ht (avg)
Spin Score (max)
Underclass Invitational (Invite Only)
Jan 10, 2021
Trackman - Fastball
84.1
Velocity (max)
80.7 - 83.1
Velo Range
79.7
Eff Velocity (avg)
2,230
Spin Rate (max)
2,029
Spin Rate (avg)
IVB (max)
IVB (avg)
HM (max)
HM (avg)
Extension (avg)
Release Ht (avg)
Spin Score (max)
Trackman - Curveball
72.8
Velocity (max)
65.9 - 71.0
Velo Range
66.1
Eff Velocity (avg)
1,982
Spin Rate (max)
1,904
Spin Rate (avg)
IVB (max)
IVB (avg)
HM (max)
HM (avg)
Extension (avg)
Release Ht (avg)
Spin Score (max)
Zone %
Pitch Scores
2021
Fastball
Hop+
A fastball with hop has a flat approach angle and visually jumps through the zone. When thrown up in the zone, it is more likely to generate a higher swing and miss average. Hop+ of 100 is MLB average.
Fastball
Sink+
A fastball with sink has low backspin and drops through the strike zone. When thrown down in the zone, it is more likely to generate a higher ground ball percentage and lower launch angle. Sink+ of 100 is MLB average.
Fastball
Rise+
A fastball with rise has a high percentage of backspin. When thrown up in the zone, it is more likely to generate a higher fly ball percentage. Rise+ of 100 is MLB average
Curveball
Hammer+
A hammer breaking ball drops vertically with velocity through the zone, or 12-to-6 movement. Hammer+ of 100 is MLB average.
Curveball
Sweep+
A sweeping breaking ball moves horizontally with velocity through the zone. Sweep+ of 100 is MLB average.
Pitching Velos
2021
Fastball
Velocity Max
The maximum observed fastball velocity in the given event year. Measured in miles per hour (MPH).
87.0
Fastball
Velocity Avg
The average velocity for all pitches of this type in the given event year. Measured in miles per hour (MPH)
83.5
Curveball
Velocity Avg
The average velocity for all pitches of this type in the given event year. Measured in miles per hour (MPH)
67.0
Game Performance


Vizual Edge

Pitch Ai

2022
Arm Speed
The maximum speed, in the direction of home plate, that the wrist is traveling. Measured in meters per second (m/s)
Arm Slot
Angle of the forearm relative to the ground between maximum external rotation (MER) and ball release (BR). Which can be a powerful player comparison metric, delivered in degrees.
Knee Extension Velo
The angular velocity of the front knee straightening after foot plant, which provides indicators of velocity potential. Measured in degrees per second.
Deception
The amount of time that the ball is visible to the hitter, after the instant of front foot strike. Measures in milliseconds.
Hip-Shoulder Separation
The difference in angle of between the hips and shoulders, occurring close to the foot plant. Measured in degrees.
2022 PBR Future Games
Jul 27, 2022
ProPlayAI - Foot Plant
Elbow Flexion (avg)
Shoulder Abduction (avg)
Hip Shoulder Seperation (avg)
ProPlayAI - MER
External Rotation (avg)
Stride Length (avg)
Horizontal Abduction (avg)
ProPlayAI - Release
Arm Speed (max)
Arm Speed (avg)
Knee Extension Velocity (max)
Knee Extension Velocity (avg)
Knee Flexion (avg)
Arm Slot (avg)
Lateral Trunk Tilt (avg)
Arm Path (avg)
Deception (avg)
Torque (avg)
Efficiency (avg)
Sequencing (avg)
Notes
News
- Most Valuable Players : Class 6A (Regions 1-4) - Jan 28, 2023
- Georgia 2024 Rankings: Post Fall Update - Dec 1, 2022
- Labor Day Challenge - Top Performers - Sep 8, 2022
- Tools & Intangibles, Part 2 (Pitchers) - Aug 11, 2022
- PBR Future Games: Team Georgia Game 2 Recap - Aug 1, 2022
- Future Games Spotlight - RHP Montrell Christian - Jul 25, 2022
- Underclass Invitational: Quick Hits - Jan 14, 2021
- Underclass Invitational: Statistical Analysis - Jan 13, 2021
- Underclass Invitational: Preview - Jan 7, 2021
- Georgia 2024 Rankings Release - Dec 15, 2020
Comments
Draft Reports
Contact
Premium Content Area
To unlock contact information, you need to purchase a ScoutPLUS subscription.
Purchase Subscription OR
Login
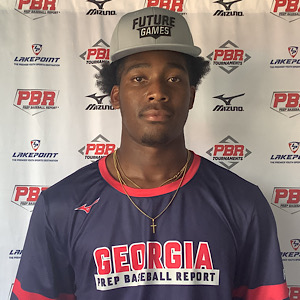
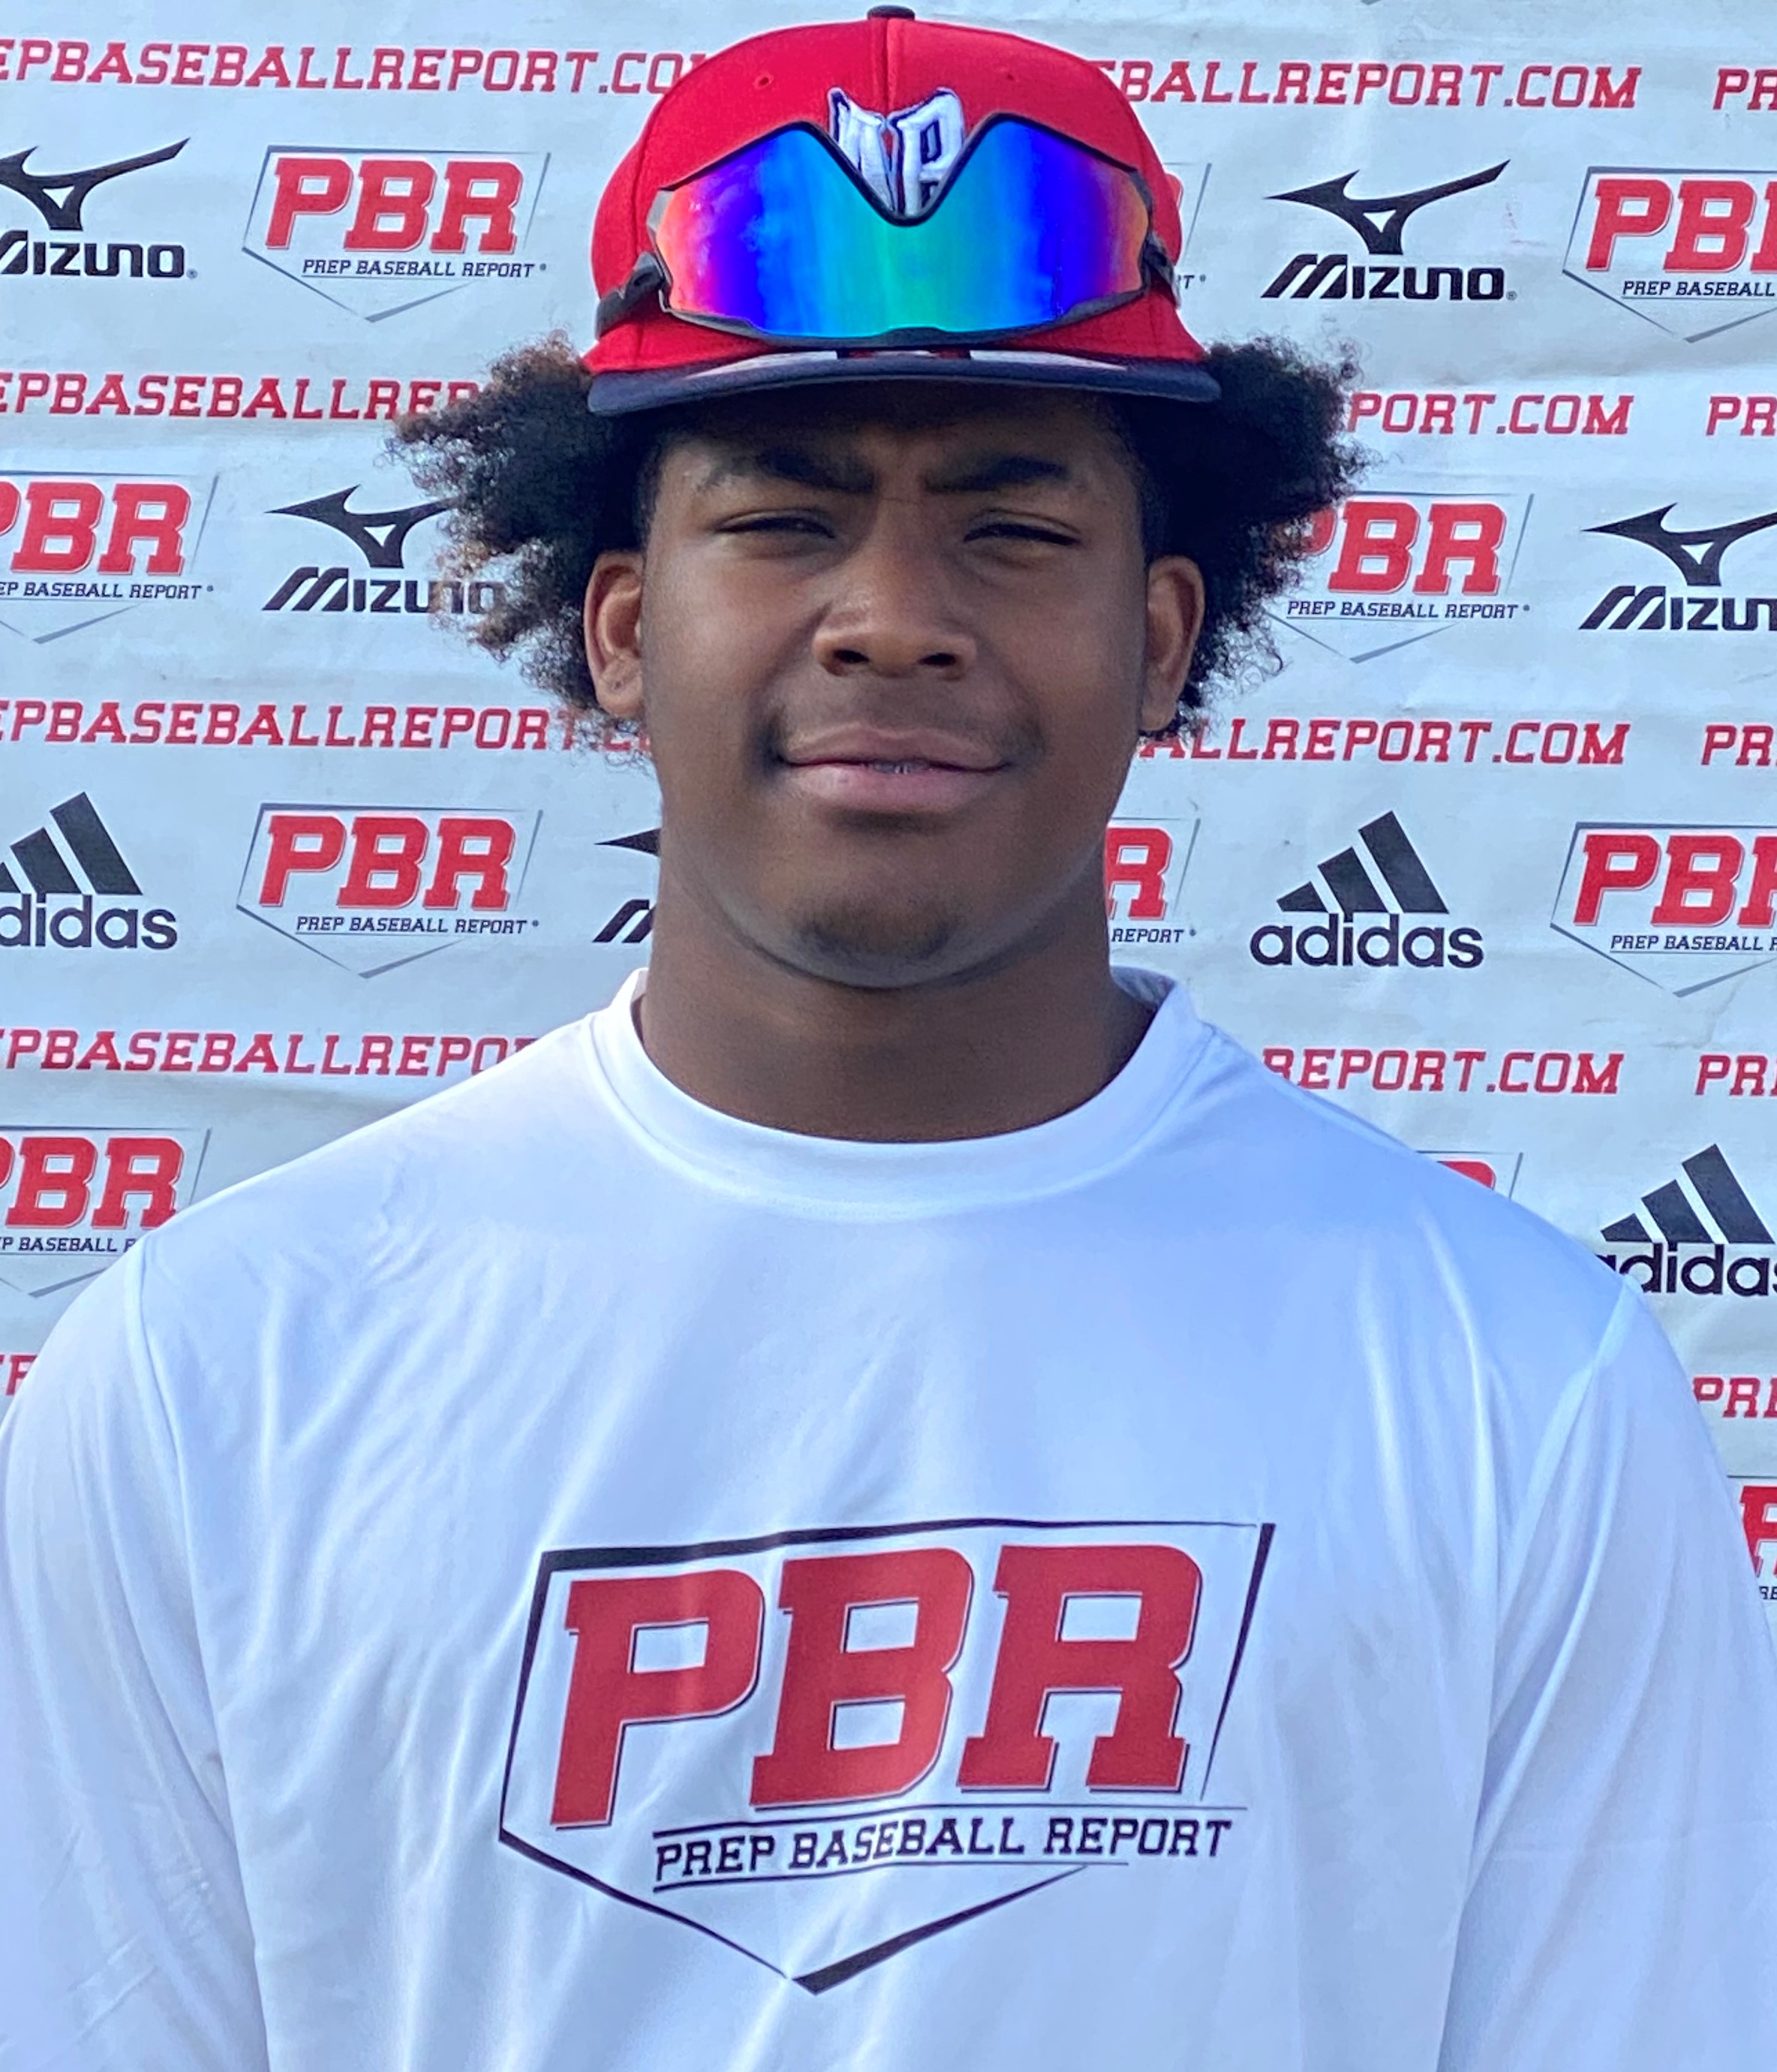
Positional Profile: RHP/3B
Body: 6-4, 219-pounds. Extra large, physical frame, strength throughout, athletic.
Hit: R/R. Balanced setup, hands load back with rhythm, short knee knock stride, good balance. Swing works short to the zone, level through, loose wrists, gap-to-gap approach, creates hard contact with whippy bat speed. Big power potential.
Power: 93.60 max exit velocity, averaged 79.36 mph. 327.00’ max distance.
Arm: R/R. INF - 85.00 mph. Short arm action to a low 3/4 slot, carry, kept throws low across the infield.
Defense: Plays through the ball with fluid footwork, good body control and mobility for size, soft glove, quick funnel into mid-section, clean on exchanges.
Run: 7.14 runner in the 60.
One of the top 2024s in the state, RHP/OF Montrell Christian Jr. (Forest Park) physically stands out amongst his peers, checking in at 6-foot-4, 219-pounds. Christian has all the makings of the next big power pitcher to come out of the state. On Sunday, he ran his fastball up to 84. He also dropped in a 12/6 breaking ball for strikes. As he continues to mature, look for the velocity to take big jumps and his offspeed to improve.
2024 Player Rankings
weighs in at an intimidating 6-foot-4, 200-pounds. It remains to be seen whether Christian Jr will end up being an arm or a bat, but at this point he is able to do both at a high level. On the mound he can work his fastball up into the mid-80s and compliments it with a nice slider. At the plate, he has a powerful swing that plays well to the pull-side. With the natural strength throughout his frame, he is able to generate hard contact to all fields.