CLASS OF 2023
RHP
1B
Nathan
Vargo
Charleston (WV)
Bethel Park (HS) • PA
6' 3" • 210LBS
R/R • 19yr 4mo
Travel Team: Team Ohio Pro Select
Bethel Park (HS) • PA
6' 3" • 210LBS
R/R • 19yr 4mo
Travel Team: Team Ohio Pro Select
Rankings
2023 National
Rankings available to Premium Subscriber
2023 State
Rankings available to Premium Subscriber
Commitment
Best Of Stats
Fastball
87.2
Velocity (max)
2/12/22
86.4 - 87.2
Velo Range
2/12/22
2133
Spin Rate (avg)
2/07/21
Changeup
77 - 78
Velo Range
7/20/22
1451
Spin Rate (avg)
2/07/21
Curveball
68 - 72
Velo Range
7/20/22
1783
Spin Rate (avg)
2/07/21
Slider
68 - 70
Velo Range
2/12/22
1764
Spin Rate (avg)
2/12/22
99.3
Exit Velocity (max)
2/07/21
89.7
Exit Velocity (avg)
2/12/22
371
Distance (max)
2/12/22
71
Sweet Spot %
2/12/22
24.4
Hand Speed (max)
2/12/22
77.9
Bat Speed (max)
2/12/22
30.2
Rot. Acc (max)
2/12/22
57
Hard Hit %
2/12/22
7.2
60
2/12/22
-
30-yd
-
10-yd
-
Run speed (max)
86
INF Velo
2/07/21
-
OF Velo
-
C Velo
-
Pop Time
Positional Tools
2022
2021
2020
2019
2018
60 Yard Dash
The athlete's fastest 60-yard dash time in the given event year. Measured in seconds (s)
7.20
Power / Speed Score
A simple calculation that divides the athlete’s Exit Velocity Max by the athlete’s 60 Yard Dash time for the given event year. For example, 98 MPH / 7.00s = 14.00.
13.8
60 Yard Dash
The athlete's fastest 60-yard dash time in the given event year. Measured in seconds (s)
7.53
Infield Velocity
The athlete's maximum throwing velocity from an infield position in the given event year. Measured in miles per hour (MPH).
86.0
Power / Speed Score
A simple calculation that divides the athlete’s Exit Velocity Max by the athlete’s 60 Yard Dash time for the given event year. For example, 98 MPH / 7.00s = 14.00.
13.2
60 Yard Dash
The athlete's fastest 60-yard dash time in the given event year. Measured in seconds (s)
7.75
Infield Velocity
The athlete's maximum throwing velocity from an infield position in the given event year. Measured in miles per hour (MPH).
77.0
Power / Speed Score
A simple calculation that divides the athlete’s Exit Velocity Max by the athlete’s 60 Yard Dash time for the given event year. For example, 98 MPH / 7.00s = 14.00.
11.4
Home to First
The athlete's fastest home-to-first time in the given event year. Measured from bat-on-ball to foot-on-bag, in seconds (s).
5.02
Infield Velocity
The athlete's maximum throwing velocity from an infield position in the given event year. Measured in miles per hour (MPH).
68.0
60 Yard Dash
The athlete's fastest 60-yard dash time in the given event year. Measured in seconds (s)
8.83
Home to First
The athlete's fastest home-to-first time in the given event year. Measured from bat-on-ball to foot-on-bag, in seconds (s).
5.22
Infield Velocity
The athlete's maximum throwing velocity from an infield position in the given event year. Measured in miles per hour (MPH).
67.0
Power / Speed Score
A simple calculation that divides the athlete’s Exit Velocity Max by the athlete’s 60 Yard Dash time for the given event year. For example, 98 MPH / 7.00s = 14.00.
8.9
Hitting

2022
2021
Exit Velocity Max
The highest exit velocity of any batted ball in the given event year. Measured in miles per hour (MPH).
99.3
Exit Velocity Avg
Average exit velocity of all batted balls in the given event year. Measured in miles per hour (MPH).
89.7
Distance Max
The highest flight distance of any batted ball in the given event year. Measured in feet (ft).
371
Distance Avg
Average flight distance of all batted balls in the given event year. Measured in feet (ft).
243
Launch Angle Avg
Average launch angle of all batted balls in the given event year. Measured in degrees.
24.6
Hard Hit %
Percentage of batted balls with exit velocities over 95 MPH in the given event year.
Sweet Spot %
Percentage of batted balls in the given event year with a launch angle between 8° and 32°.
Line Drive %
Percentage of batted balls with launch angles between 10 and 25 degrees in the given event year.
Fly Ball %
Percentage of batted balls with launch angles between 25 and 50 degrees in the given event year.
Ground Ball %
Percentage of batted balls with launch angles below 10 degrees in the given event year.
Exit Velocity Max
The highest exit velocity of any batted ball in the given event year. Measured in miles per hour (MPH).
99.3
Exit Velocity Avg
Average exit velocity of all batted balls in the given event year. Measured in miles per hour (MPH).
87.2
Distance Max
The highest flight distance of any batted ball in the given event year. Measured in feet (ft).
332
Distance Avg
Average flight distance of all batted balls in the given event year. Measured in feet (ft).
241
Launch Angle Avg
Average launch angle of all batted balls in the given event year. Measured in degrees.
25.0
Hard Hit %
Percentage of batted balls with exit velocities over 95 MPH in the given event year.
Sweet Spot %
Percentage of batted balls in the given event year with a launch angle between 8° and 32°.
Line Drive %
Percentage of batted balls with launch angles between 10 and 25 degrees in the given event year.
Fly Ball %
Percentage of batted balls with launch angles between 25 and 50 degrees in the given event year.
Ground Ball %
Percentage of batted balls with launch angles below 10 degrees in the given event year.
2022 Preseason All-State - Southwest (Afternoon Session)
Feb 12, 2022
Trackman - Hitting
99.3
Exit Velocity (max)
89.7
Exit Velocity (avg)
243
Distance (avg)
371
Distance (max)
Hard Hit %
Sweet Spot %
Line Drive %
Fly Ball %
Ground Ball %
2021 Preseason All-State - Southwest (PM Session)
Feb 7, 2021
Trackman - Hitting
99.3
Exit Velocity (max)
87.2
Exit Velocity (avg)
241
Distance (avg)
332
Distance (max)
Hard Hit %
Sweet Spot %
Line Drive %
Fly Ball %
Ground Ball %
Hitting

2022
2021
Hand Speed Max
The highest Peak Hand Speed of any swing in the given event year.
24.4
Hand Speed Avg
The average Peak Hand Speed for all swings in the given event year.
22.5
Bat Speed Max
The highest Bat Speed of any swing in the given event year.
77.9
Bat Speed Avg
The average Bat Speed for all swings in the given event year.
74.6
Rotational Acceleration Max
The highest Rotational Acceleration of any swing in the given event year.
Rotational Acceleration Avg
The average Rotational Acceleration for all swings in the given event year.
On-Plane Efficiency Max
The highest On-Plane Efficiency of any swing in the given event year.
On-Plane Efficiency Avg
The average On-Plane Efficiency for all swings in the given event year.
Hand Speed Max
The highest Peak Hand Speed of any swing in the given event year.
22.0
Hand Speed Avg
The average Peak Hand Speed for all swings in the given event year.
20.4
Bat Speed Max
The highest Bat Speed of any swing in the given event year.
74.9
Bat Speed Avg
The average Bat Speed for all swings in the given event year.
71.0
Rotational Acceleration Max
The highest Rotational Acceleration of any swing in the given event year.
Rotational Acceleration Avg
The average Rotational Acceleration for all swings in the given event year.
On-Plane Efficiency Max
The highest On-Plane Efficiency of any swing in the given event year.
On-Plane Efficiency Avg
The average On-Plane Efficiency for all swings in the given event year.
2022 Preseason All-State - Southwest (Afternoon Session)
Feb 12, 2022
Blast - Hitting
24.4
Hand Speed (max)
22.5
Hand Speed (avg)
77.9
Bat Speed (max)
74.6
Bat Speed (avg)
Rot. Acc (max)
Rot. Acc (avg)
On Plane Eff (avg)
MaxOnPlaneEfficiency
2021 Preseason All-State - Southwest (PM Session)
Feb 7, 2021
Blast - Hitting
22.0
Hand Speed (max)
20.4
Hand Speed (avg)
74.9
Bat Speed (max)
71.0
Bat Speed (avg)
Rot. Acc (max)
Rot. Acc (avg)
On Plane Eff (avg)
MaxOnPlaneEfficiency
Pitching

2022
2021
Fastball
Velocity Max
The maximum observed fastball velocity in the given event year. Measured in miles per hour (MPH).
87.2
Fastball
Velocity Avg
The average velocity for all pitches of this type in the given event year. Measured in miles per hour (MPH).
86.8
Fastball
Spin Rate Avg
The average rate of spin for all pitches of this type in the given event year. Measured in rotations per minute (RPM).
2112
Fastball
Spin Score Avg
The average Bauer Units value of all fastballs in the given event year. Bauer Units are calculated for each pitch by dividing Spin Rate by Velocity.
24.3
Fastball
Total Movement Avg
The average total non-gravity movement for all pitches of this type in the given event year. Measured in inches (in).
Changeup
Velocity Avg
The average velocity for all pitches of this type in the given event year. Measured in miles per hour (MPH).
76.4
Changeup
Spin Rate Avg
The average rate of spin for all pitches of this type in the given event year. Measured in rotations per minute (RPM).
1427
Changeup
Total Movement Avg
The average total non-gravity movement for all pitches of this type in the given event year. Measured in inches (in).
Slider
Velocity Avg
The average velocity for all pitches of this type in the given event year. Measured in miles per hour (MPH).
69.0
Slider
Spin Rate Avg
The average rate of spin for all pitches of this type in the given event year. Measured in rotations per minute (RPM).
1764
Slider
Total Movement Avg
The average total non-gravity movement for all pitches of this type in the given event year. Measured in inches (in).
Fastball
Velocity Max
The maximum observed fastball velocity in the given event year. Measured in miles per hour (MPH).
85.5
Fastball
Velocity Avg
The average velocity for all pitches of this type in the given event year. Measured in miles per hour (MPH).
84.0
Fastball
Spin Rate Avg
The average rate of spin for all pitches of this type in the given event year. Measured in rotations per minute (RPM).
2133
Fastball
Spin Score Avg
The average Bauer Units value of all fastballs in the given event year. Bauer Units are calculated for each pitch by dividing Spin Rate by Velocity.
25.4
Fastball
Total Movement Avg
The average total non-gravity movement for all pitches of this type in the given event year. Measured in inches (in).
Curveball
Velocity Avg
The average velocity for all pitches of this type in the given event year. Measured in miles per hour (MPH).
69.7
Curveball
Spin Rate Avg
The average rate of spin for all pitches of this type in the given event year. Measured in rotations per minute (RPM).
1783
Curveball
Total Movement Avg
The average total non-gravity movement for all pitches of this type in the given event year. Measured in inches (in).
Changeup
Velocity Avg
The average velocity for all pitches of this type in the given event year. Measured in miles per hour (MPH).
75.4
Changeup
Spin Rate Avg
The average rate of spin for all pitches of this type in the given event year. Measured in rotations per minute (RPM).
1451
Changeup
Total Movement Avg
The average total non-gravity movement for all pitches of this type in the given event year. Measured in inches (in).
2022 Preseason All-State - Southwest (Afternoon Session)
Feb 12, 2022
Trackman - Fastball
87.2
Velocity (max)
86.4 - 87.2
Velo Range
85.0
Eff Velocity (avg)
2,260
Spin Rate (max)
2,112
Spin Rate (avg)
IVB (max)
IVB (avg)
HM (max)
HM (avg)
Extension (avg)
Release Ht (avg)
Spin Score (max)
Trackman - Slider
70.0
Velocity (max)
68.0 - 70.0
Velo Range
67.4
Eff Velocity (avg)
1,780
Spin Rate (max)
1,764
Spin Rate (avg)
IVB (max)
IVB (avg)
HM (max)
HM (avg)
Extension (avg)
Release Ht (avg)
Spin Score (max)
Zone %
Trackman - ChangeUp
77.5
Velocity (max)
75.3 - 77.5
Velo Range
74.2
Eff Velocity (avg)
1,503
Spin Rate (max)
1,427
Spin Rate (avg)
IVB (max)
IVB (avg)
HM (max)
HM (avg)
Extension (avg)
Release Ht (avg)
Spin Score (max)
Zone %
2021 Preseason All-State - Southwest (PM Session)
Feb 7, 2021
Trackman - Fastball
85.5
Velocity (max)
83.1 - 84.9
Velo Range
83.2
Eff Velocity (avg)
2,198
Spin Rate (max)
2,133
Spin Rate (avg)
IVB (max)
IVB (avg)
HM (max)
HM (avg)
Extension (avg)
Release Ht (avg)
Spin Score (max)
Zone %
Trackman - Curveball
70.4
Velocity (max)
69.0 - 70.4
Velo Range
69.1
Eff Velocity (avg)
1,787
Spin Rate (max)
1,783
Spin Rate (avg)
IVB (max)
IVB (avg)
HM (max)
HM (avg)
Extension (avg)
Release Ht (avg)
Spin Score (max)
Zone %
Trackman - ChangeUp
75.4
Velocity (max)
75.0
Eff Velocity (avg)
1,451
Spin Rate (max)
1,451
Spin Rate (avg)
IVB (max)
IVB (avg)
HM (max)
HM (avg)
Extension (avg)
Release Ht (avg)
Spin Score (max)
Zone %
Pitch Scores
2022
Fastball
Hop+
A fastball with hop has a flat approach angle and visually jumps through the zone. When thrown up in the zone, it is more likely to generate a higher swing and miss average. Hop+ of 100 is MLB average.
Fastball
Sink+
A fastball with sink has low backspin and drops through the strike zone. When thrown down in the zone, it is more likely to generate a higher ground ball percentage and lower launch angle. Sink+ of 100 is MLB average.
Fastball
Rise+
A fastball with rise has a high percentage of backspin. When thrown up in the zone, it is more likely to generate a higher fly ball percentage. Rise+ of 100 is MLB average
Pitching Velos
2022
2021
2020
2019
2018
Fastball
Velocity Max
The maximum observed fastball velocity in the given event year. Measured in miles per hour (MPH).
85.0
Fastball
Velocity Avg
The average velocity for all pitches of this type in the given event year. Measured in miles per hour (MPH)
83.5
Curveball
Velocity Avg
The average velocity for all pitches of this type in the given event year. Measured in miles per hour (MPH)
70.0
Changeup
Velocity Avg
The average velocity for all pitches of this type in the given event year. Measured in miles per hour (MPH)
77.5
Fastball
Velocity Max
The maximum observed fastball velocity in the given event year. Measured in miles per hour (MPH).
86.0
Fastball
Velocity Avg
The average velocity for all pitches of this type in the given event year. Measured in miles per hour (MPH)
84.0
Curveball
Velocity Avg
The average velocity for all pitches of this type in the given event year. Measured in miles per hour (MPH)
69.5
Changeup
Velocity Avg
The average velocity for all pitches of this type in the given event year. Measured in miles per hour (MPH)
74.5
Fastball
Velocity Max
The maximum observed fastball velocity in the given event year. Measured in miles per hour (MPH).
78.0
Fastball
Velocity Avg
The average velocity for all pitches of this type in the given event year. Measured in miles per hour (MPH)
76.5
Curveball
Velocity Avg
The average velocity for all pitches of this type in the given event year. Measured in miles per hour (MPH)
58.5
Changeup
Velocity Avg
The average velocity for all pitches of this type in the given event year. Measured in miles per hour (MPH)
62.5
Fastball
Velocity Max
The maximum observed fastball velocity in the given event year. Measured in miles per hour (MPH).
73.0
Fastball
Velocity Avg
The average velocity for all pitches of this type in the given event year. Measured in miles per hour (MPH)
71.0
Curveball
Velocity Avg
The average velocity for all pitches of this type in the given event year. Measured in miles per hour (MPH)
56.5
Changeup
Velocity Avg
The average velocity for all pitches of this type in the given event year. Measured in miles per hour (MPH)
61.5
Fastball
Velocity Avg
The average velocity for all pitches of this type in the given event year. Measured in miles per hour (MPH)
67.0
Curveball
Velocity Avg
The average velocity for all pitches of this type in the given event year. Measured in miles per hour (MPH)
52.2
Changeup
Velocity Avg
The average velocity for all pitches of this type in the given event year. Measured in miles per hour (MPH)
54.0
Game Performance

Visual Edge

Pitch Ai

Notes
News
- Preseason 2022: Trackman Hitting Leaderboard (Class of '23) - May 3, 2022
- Top Performer Spotlight: 2023 RHP/1B Nathan Vargo (Bethel Park) - Mar 29, 2022
- On Deck Preview:Southwest (2 of 3) - Jan 10, 2022
- Year in Review: Peak Exit Velocity via Trackman / Class of 2023 - Dec 15, 2021
- PBR-T Pennsylvania Select Scout Blog: Day 2 - Jul 17, 2021
- PBR Junior Future Games Update: 12U Team Pennsylvania Roster Finalized - Apr 10, 2018
- Pittsburgh Outlaws Scout Day Results - 1/21/18 - Jan 23, 2018
Comments
Draft Reports
Contact
Premium Content Area
To unlock contact information, you need to purchase a ScoutPLUS subscription.
Purchase Subscription OR
Login


 Sign in to view rankings
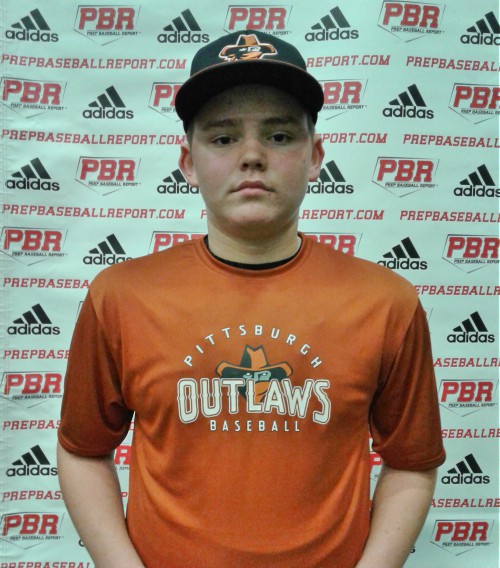
Physical: 6-foot-3, 215 pounds; Muscular, athletic build. 7.2 runner in the 60.
Offensively: RHH. Even setup, with feet wide spread; flat bat to start. Lifts hands with an up and down stride for timing. Stays behind the ball while showing an aggressive lower half. Showed a direct swing path with a two handed finish. More line drives than flyballs and groundballs with a peak exit velocity of 99 MPH via Trackman.
Pitching: Uses a glove side setup while using a side step. Belt high leg drive with a slight coil away from the plate. Has a moderate stride while landing slightly closed. Moderate arm swing while showing effortless and fluid actions; standard 3/4 slot. Square to the plate with finish. FB: Peak velo of 87 MPH, while sitting 86-87 MPH; life through the zone. SL: 68-70 MPH; short action. CH: 76-78 MPH; fading action.
Physical: Large, durable 6-foot-3, 210-pound frame with an imposing presence on the bump. 7.53 runner in the 60-yard dash.
Offensively: RHH - Open, loose stance with the hands showing rhythm at the ear, utilized a leg hang with ability to stay behind the baseball at impact, the bat head played through a whippy, slight uphill attack with short, fluid turns at the hitting window; showcased a pull-side approach generating a 67% fly ball rate, a 332 foot max batted ball distance points to doubles power at the moment and will increase soon when looking at a standout 99 mph bat-exit velocity during batting practice. A peak of 28 G’s of rotational acceleration suggests an extremely high power ceiling down the line.
Defensively: The first baseman flashed feel around the bag, arriving on time to the baseball with the left foot. Got the chest downhill with a soft glove hand fielding off the middle of his body; stayed relatively low throughout the posture allowing for the ability to get in-line quickly with the hips/shoulders. Let it rip from an accurate ¾ slot yielding easy 86 mph arm strength across the diamond.
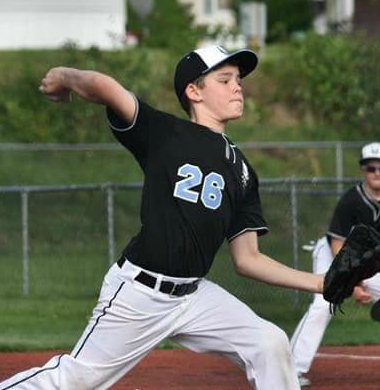
Pitching: RHP - The righty started from the middle of the rubber with up tempo pace in the delivery, quick side rocker and raced into a repeatable stack position with hip coil; worked violently down the mound with an upright torso position through the land phase. FB ranged from 83-85, T86 mph with solid ride (21 inches of IVB) paired with impressive extension on the front side (6.35 feet on average). Mixed a quality 68-70 mph breaker with late, two plane shape. Countered with a 73-75 mph CH that he effectively killed spin on (1451 RPM average) generating consistent fade to the arm-side (12.7 inches on average).
Showcased a physically advanced 6-foot-2, 195-pound frame with present strength in an overall projectable frame. The primary right-handed pitcher sat 75-78 mph out of a high ¾ arm-slot with a “straight-arm” pause at the hip in the takeaway. Mixed in a 57-60 mph curveball showing occasional 11/5 shape. Countered with a 61-64 mph changeup that will be improved with increased arm-speed. The right-handed hitter begins with a balanced, even stance utilizing a knee-knock stride to initiate a slightly uphill barrel path with weight shift into the hitting zone. Generated hand speed with occasional length towards contact point allowing for pull-side lift during batting practice. Recorded an impressive 88 mph bat-exit velocity while hitting into a stiff front side and ran a 7.75 60-yard dash. The first baseman showed off adequate footwork while playing moderately low to the ground using a soft glove hand to play through the ball. Utilized occasional inside turns on double play footwork yielding accurate 77 mph arm-strength across the diamond.
6-foot-1, 190-pound right-handed hitter begins from a balanced, square stance with a leg-lift stride. Showcased advanced feel, generating consistent backspin evidenced by his 82 mph bat exit velocity. Utilizes good momentum defensively, which lets his 68 mph infield-arm carry across the infield. Right-handed pitcher starts from a high 3/4 arm-slot with a good takeaway. Recorded one of the top overall performances of the day. Fastball showed arm-side-run at 70-72 mph while topping out at 73 mph. Curveball was 55-58 mph with 11/5 rotation. Changeup featured at 60-63 with arm-side-run with room for improvement on its sell.
Offensively, initiates swing from neutral set up with short stride staying neutral. Weight and separation are adequate. Benefit would be gained from more aggressive connection of back elbow . There is leverage while transferring weight into firm front side. A 77 mph bat exit velocity was recorded. There s considerable offensive upside in this very young, developing player.
Defensively, would benefit from greater commitment to working bottom up and playing through baseball while following throws.
On the mound working out of high 3/4 arm slot there is balance, rhythm and repeatability.. Arm action is long and loose with low effort to delivery. FB was up to 68 mph with arm side run. CB sat 47-48 mph showing 11-5 shape and moderate depth. CH is work in,progress with slowing of arm. Solid command was demonstrated. Overall, Vargo is advanced on the hill at this stage of his development.
+ 2018 PBR Junior Future Games Selection (12U Team Pennsylvania)