CLASS OF 2022
3B
SS
Jake
Munroe
Louisville
Champaign Central (HS) • IL
6' 2" • 225LBS
R/R • 21yr 2mo
Champaign Central (HS) • IL
6' 2" • 225LBS
R/R • 21yr 2mo
Rankings
2022 National
Rankings available to Premium Subscriber
2022 State
Rankings available to Premium Subscriber
Commitment
Best Of Stats
25.3
Hand Speed (max)
7/15/20
78.5
Bat Speed (max)
7/15/20
20.4
Rot. Acc (max)
7/15/20
100
Hard Hit %
9/07/23
105.3
Exit Velocity (max)
9/07/23
99.3
Exit Velocity (avg)
9/07/23
396
Distance (max)
9/07/23
90
Sweet Spot %
6/22/21
6.89
60
6/22/21
3.91
30-yd
10/05/22
1.71
10-yd
10/05/22
20
Run speed (max)
10/05/22
87
INF Velo
9/07/23
-
OF Velo
-
C Velo
-
Pop Time
Positional Tools
2023
2022
2021
2020
2019
Infield Velocity
The athlete's maximum throwing velocity from an infield position in the given event year. Measured in miles per hour (MPH).
87.0
60 Yard Dash
The athlete's fastest 60-yard dash time in the given event year. Measured in seconds (s)
6.97
Infield Velocity
The athlete's maximum throwing velocity from an infield position in the given event year. Measured in miles per hour (MPH).
85.0
Power / Speed Score
A simple calculation that divides the athlete’s Exit Velocity Max by the athlete’s 60 Yard Dash time for the given event year. For example, 98 MPH / 7.00s = 14.00.
14.1
60 Yard Dash
The athlete's fastest 60-yard dash time in the given event year. Measured in seconds (s)
6.89
Infield Velocity
The athlete's maximum throwing velocity from an infield position in the given event year. Measured in miles per hour (MPH).
81.0
Power / Speed Score
A simple calculation that divides the athlete’s Exit Velocity Max by the athlete’s 60 Yard Dash time for the given event year. For example, 98 MPH / 7.00s = 14.00.
13.9
60 Yard Dash
The athlete's fastest 60-yard dash time in the given event year. Measured in seconds (s)
7.38
Infield Velocity
The athlete's maximum throwing velocity from an infield position in the given event year. Measured in miles per hour (MPH).
79.0
Power / Speed Score
A simple calculation that divides the athlete’s Exit Velocity Max by the athlete’s 60 Yard Dash time for the given event year. For example, 98 MPH / 7.00s = 14.00.
12.9
60 Yard Dash
The athlete's fastest 60-yard dash time in the given event year. Measured in seconds (s)
7.91
Infield Velocity
The athlete's maximum throwing velocity from an infield position in the given event year. Measured in miles per hour (MPH).
75.0
Power / Speed Score
A simple calculation that divides the athlete’s Exit Velocity Max by the athlete’s 60 Yard Dash time for the given event year. For example, 98 MPH / 7.00s = 14.00.
11.0
Hitting

2023
2022
2021
2020
Exit Velocity Max
The highest exit velocity of any batted ball in the given event year. Measured in miles per hour (MPH).
105.3
Exit Velocity Avg
Average exit velocity of all batted balls in the given event year. Measured in miles per hour (MPH).
99.3
Distance Max
The highest flight distance of any batted ball in the given event year. Measured in feet (ft).
396
Distance Avg
Average flight distance of all batted balls in the given event year. Measured in feet (ft).
256
Launch Angle Avg
Average launch angle of all batted balls in the given event year. Measured in degrees.
19.8
Hard Hit %
Percentage of batted balls with exit velocities over 95 MPH in the given event year.
Sweet Spot %
Percentage of batted balls in the given event year with a launch angle between 8° and 32°.
Line Drive %
Percentage of batted balls with launch angles between 10 and 25 degrees in the given event year.
Fly Ball %
Percentage of batted balls with launch angles between 25 and 50 degrees in the given event year.
Ground Ball %
Percentage of batted balls with launch angles below 10 degrees in the given event year.
Exit Velocity Max
The highest exit velocity of any batted ball in the given event year. Measured in miles per hour (MPH).
98.0
Exit Velocity Avg
Average exit velocity of all batted balls in the given event year. Measured in miles per hour (MPH).
91.5
Distance Max
The highest flight distance of any batted ball in the given event year. Measured in feet (ft).
372
Distance Avg
Average flight distance of all batted balls in the given event year. Measured in feet (ft).
293
Launch Angle Avg
Average launch angle of all batted balls in the given event year. Measured in degrees.
28.4
Hard Hit %
Percentage of batted balls with exit velocities over 95 MPH in the given event year.
Sweet Spot %
Percentage of batted balls in the given event year with a launch angle between 8° and 32°.
Line Drive %
Percentage of batted balls with launch angles between 10 and 25 degrees in the given event year.
Fly Ball %
Percentage of batted balls with launch angles between 25 and 50 degrees in the given event year.
Ground Ball %
Percentage of batted balls with launch angles below 10 degrees in the given event year.
Exit Velocity Max
The highest exit velocity of any batted ball in the given event year. Measured in miles per hour (MPH).
96.0
Exit Velocity Avg
Average exit velocity of all batted balls in the given event year. Measured in miles per hour (MPH).
90.9
Distance Max
The highest flight distance of any batted ball in the given event year. Measured in feet (ft).
359
Distance Avg
Average flight distance of all batted balls in the given event year. Measured in feet (ft).
267
Launch Angle Avg
Average launch angle of all batted balls in the given event year. Measured in degrees.
18.8
Hard Hit %
Percentage of batted balls with exit velocities over 95 MPH in the given event year.
Sweet Spot %
Percentage of batted balls in the given event year with a launch angle between 8° and 32°.
Line Drive %
Percentage of batted balls with launch angles between 10 and 25 degrees in the given event year.
Fly Ball %
Percentage of batted balls with launch angles between 25 and 50 degrees in the given event year.
Ground Ball %
Percentage of batted balls with launch angles below 10 degrees in the given event year.
Exit Velocity Max
The highest exit velocity of any batted ball in the given event year. Measured in miles per hour (MPH).
95.1
Exit Velocity Avg
Average exit velocity of all batted balls in the given event year. Measured in miles per hour (MPH).
80.2
Distance Max
The highest flight distance of any batted ball in the given event year. Measured in feet (ft).
342
Distance Avg
Average flight distance of all batted balls in the given event year. Measured in feet (ft).
224
Launch Angle Avg
Average launch angle of all batted balls in the given event year. Measured in degrees.
31.4
Hard Hit %
Percentage of batted balls with exit velocities over 95 MPH in the given event year.
Sweet Spot %
Percentage of batted balls in the given event year with a launch angle between 8° and 32°.
Line Drive %
Percentage of batted balls with launch angles between 10 and 25 degrees in the given event year.
Fly Ball %
Percentage of batted balls with launch angles between 25 and 50 degrees in the given event year.
Ground Ball %
Percentage of batted balls with launch angles below 10 degrees in the given event year.
PBR IL: John A Logan / SIC / Rend Lake / Kaskaskia Scout Day
Sep 7, 2023
Trackman - Hitting
105.3
Exit Velocity (max)
99.3
Exit Velocity (avg)
256
Distance (avg)
396
Distance (max)
Hard Hit %
Barrel %
Sweet Spot %
Line Drive %
Fly Ball %
Ground Ball %
PBR IL: John A Logan / SIC / Rend Lake / Kaskaskia Scout Day
Oct 5, 2022
Trackman - Hitting
98.0
Exit Velocity (max)
91.5
Exit Velocity (avg)
293
Distance (avg)
372
Distance (max)
Hard Hit %
Sweet Spot %
Line Drive %
Fly Ball %
Ground Ball %
Top Prospect - Chicago (Invite Only)
Jun 22, 2021
Trackman - Hitting
96.0
Exit Velocity (max)
90.9
Exit Velocity (avg)
267
Distance (avg)
359
Distance (max)
Hard Hit %
Sweet Spot %
Line Drive %
Fly Ball %
Ground Ball %
Class of 2022 Showcase
Jul 15, 2020
Trackman - Hitting
95.1
Exit Velocity (max)
80.2
Exit Velocity (avg)
224
Distance (avg)
342
Distance (max)
Hard Hit %
Sweet Spot %
Line Drive %
Fly Ball %
Ground Ball %
Hitting

2023
2022
2021
2020
Hand Speed Max
The highest Peak Hand Speed of any swing in the given event year.
23.6
Hand Speed Avg
The average Peak Hand Speed for all swings in the given event year.
22.1
Bat Speed Max
The highest Bat Speed of any swing in the given event year.
77.9
Bat Speed Avg
The average Bat Speed for all swings in the given event year.
73.3
Rotational Acceleration Max
The highest Rotational Acceleration of any swing in the given event year.
Rotational Acceleration Avg
The average Rotational Acceleration for all swings in the given event year.
On-Plane Efficiency Max
The highest On-Plane Efficiency of any swing in the given event year.
On-Plane Efficiency Avg
The average On-Plane Efficiency for all swings in the given event year.
Hand Speed Max
The highest Peak Hand Speed of any swing in the given event year.
23.1
Hand Speed Avg
The average Peak Hand Speed for all swings in the given event year.
21.5
Bat Speed Max
The highest Bat Speed of any swing in the given event year.
76.1
Bat Speed Avg
The average Bat Speed for all swings in the given event year.
70.8
Rotational Acceleration Max
The highest Rotational Acceleration of any swing in the given event year.
Rotational Acceleration Avg
The average Rotational Acceleration for all swings in the given event year.
On-Plane Efficiency Max
The highest On-Plane Efficiency of any swing in the given event year.
On-Plane Efficiency Avg
The average On-Plane Efficiency for all swings in the given event year.
Hand Speed Max
The highest Peak Hand Speed of any swing in the given event year.
25.1
Hand Speed Avg
The average Peak Hand Speed for all swings in the given event year.
21.4
Bat Speed Max
The highest Bat Speed of any swing in the given event year.
75.8
Bat Speed Avg
The average Bat Speed for all swings in the given event year.
70.5
Rotational Acceleration Max
The highest Rotational Acceleration of any swing in the given event year.
Rotational Acceleration Avg
The average Rotational Acceleration for all swings in the given event year.
On-Plane Efficiency Max
The highest On-Plane Efficiency of any swing in the given event year.
On-Plane Efficiency Avg
The average On-Plane Efficiency for all swings in the given event year.
Hand Speed Max
The highest Peak Hand Speed of any swing in the given event year.
25.3
Hand Speed Avg
The average Peak Hand Speed for all swings in the given event year.
24.4
Bat Speed Max
The highest Bat Speed of any swing in the given event year.
78.5
Bat Speed Avg
The average Bat Speed for all swings in the given event year.
74.7
Rotational Acceleration Max
The highest Rotational Acceleration of any swing in the given event year.
Rotational Acceleration Avg
The average Rotational Acceleration for all swings in the given event year.
On-Plane Efficiency Max
The highest On-Plane Efficiency of any swing in the given event year.
On-Plane Efficiency Avg
The average On-Plane Efficiency for all swings in the given event year.
PBR IL: John A Logan / SIC / Rend Lake / Kaskaskia Scout Day
Sep 7, 2023
Blast - Hitting
23.6
Hand Speed (max)
22.1
Hand Speed (avg)
77.9
Bat Speed (max)
73.3
Bat Speed (avg)
Rot. Acc (max)
Rot. Acc (avg)
On Plane Eff (avg)
MaxOnPlaneEfficiency
PBR IL: John A Logan / SIC / Rend Lake / Kaskaskia Scout Day
Oct 5, 2022
Blast - Hitting
23.1
Hand Speed (max)
21.5
Hand Speed (avg)
76.1
Bat Speed (max)
70.8
Bat Speed (avg)
Rot. Acc (max)
Rot. Acc (avg)
On Plane Eff (avg)
MaxOnPlaneEfficiency
Top Prospect - Chicago (Invite Only)
Jun 22, 2021
Blast - Hitting
25.1
Hand Speed (max)
21.4
Hand Speed (avg)
75.8
Bat Speed (max)
70.5
Bat Speed (avg)
Rot. Acc (max)
Rot. Acc (avg)
On Plane Eff (avg)
MaxOnPlaneEfficiency
Class of 2022 Showcase
Jul 15, 2020
Blast - Hitting
25.3
Hand Speed (max)
24.4
Hand Speed (avg)
78.5
Bat Speed (max)
74.7
Bat Speed (avg)
Rot. Acc (max)
Rot. Acc (avg)
On Plane Eff (avg)
MaxOnPlaneEfficiency
Pitching

Pitch Scores
Pitching Velos
Game Performance

2022
10 Yard Dash
The athlete's fastest 0-10-yard split time in the given event year. Measured in seconds.
1.71
30 Yard Dash
The athlete's fastest 0-30-yard split time in the given event year. Measured in seconds.
3.91
60 Yard Dash
The athlete's fastest 0-60-yard time in the given event year. Measured in seconds.
6.97
Top Speed (MPH)
The athlete's fastest split time converted to miles per hour.
Visual Edge

2021
Edge Score
The highest Edge Score within the given year. Edge Score is a comprehensive score that takes the core-six visual skills into account, providing an assessment of an athlete’s overall visual ability.
72.43
Pitch Ai

Notes
News
- Prep Baseball JUCO Wire: Top 150 Prospects - Dec 14, 2023
- PBR IL: John A. Logan / SIC / Rend Lake / Kaskaskia, Takeaways - Sep 14, 2023
- PBR IL: John A. Logan / SIC / Rend Lake / Kaskaskia: Data Dive - Oct 11, 2022
- 2022 PBR Third Team All-State - Jun 28, 2022
- IHSA Playoff Diamond Notes - Jun 2, 2022
- Best of 2021: 60-Yard Dash Leaders - Jan 5, 2022
- Top Prospect - Chicago: Position Player Analysis - Nov 10, 2021
- 2021 PBR Second Team All-State - Jul 16, 2021
- PBR Illinois Diamond Notes: Week 5 - May 21, 2021
- Class of 2022 Showcase: Infield Analysis - Oct 1, 2020
- Central Illinois Scout Day: Takeaways - Jul 13, 2020
- Central Illinois Open: Infielder Analysis - Oct 1, 2019
Comments
Draft Reports
Contact
Premium Content Area
To unlock contact information, you need to purchase a ScoutPLUS subscription.
Purchase Subscription OR
Login


 Sign in to view rankings
Jake Munroe, CIF, Champaign Central (IL), 2022
Louisville commit and true sophomore. Physical, 6-foot-2, 225-pound frame, durable with a strong lower-half. The right-handed hitter put on a show during BP, reaching up to 105.3 mph for his max EV while averaging 99.2 mph with a max distance of 392’, driving the ball with authority to the entire field. He registered every ball he hit at over 90 mph, per TrackMan while staying on the ‘sweet spot’ 92.9% of the time. His swing has little perceived effort and minimal unnecessary movement, looking to play well against premier velocity. On the infield, Munroe has steady hands with smooth actions, reaching up to 87 mph across the diamond with carry. Munroe was one of the top performers for the Vols last spring, putting up a .339 batting average in 174 at-bats with 12 home runs, 14 doubles and 54 RBIs.
Positional Profile: 3B/SS
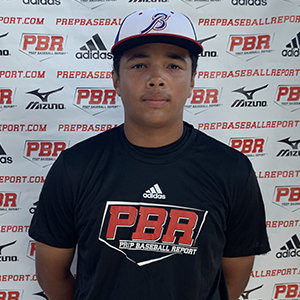
Body: 6-2, 205-pounds. Strong, broad-shouldered build.
Hit: RHH. Balanced, crouched, open stance, no hand load, dives with a long stride, stays balanced. Short level swing, line drive gap to gap approach, strong swing, flashed bat speed to the pull side.
Power: 96.02 max exit velocity, averaged 90.91 mph. 358’ max distance.
Arm: RH. INF - 81 mph. Long, loose arm action, over the top delivery, Throws are accurate with carry.
Defense: Soft hands, quick feet, athletic actions and plays through the ball.
Run: 6.89 runner in the 60.
Positional Profile: 3B/SS
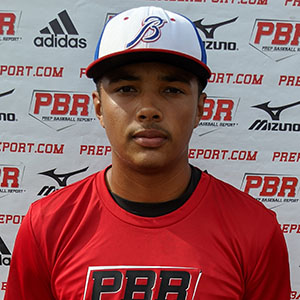
Body: 6-2, 205-pounds. Physical, wide-shouldered, strong frame.
Hit: RHH. Wide, balanced, quiet setup, short stride. Minimal wasted movement, strong short level swing, gap-to-gap approach, fluid rhythm.
Power: 92 mph exit velocity from the tee. Above 93 mph exit velocity on pitches down and in during BP, per Trackman.
Arm: RH. INF - 79 mph. Short loose arm action, high 3/4 slot, throws play accurate.
Defense: Fluid footwork, soft hands, plays through the baseball.
Run: 7.38 runner in the 60.
Positional Profile: 3B/SS
Body: 6-foot-1, 195-pounds. Wide-shouldered, strong frame.
Hit: RHH. Balanced, wide setup, minimal load and short stride. Long path, present bat strength and gap-to-gap approach.
Power: 87 mph exit velocity from the tee.
Arm: RH. INF - 75 mph. Short, firm arm action from an over-the-top slot.
Defense: Plays tall through release.
Run: 7.91 runner in the 60.