
25.2
Hand Speed (max)
3/04/23


Rankings available to Premium Subscriber
Rankings available to Premium Subscriber


To unlock contact information, you need to purchase a ScoutPLUS subscription.
Purchase Subscription Sign in to view rankings
Positional Profile: 3B/OF
Body: 6-2, 215-pounds.
Hit: RHH
Power: 93 max exit velocity, averaged 81.9 mph. 294' max distance.
Arm: RH. INF-91 mph.
ATH: 7.13 runner in the 60. 1.71 in the 10 yard split.
A sturdy, 6-foot-2, 215 pound corner infielder - Woodward posted the best infield velocity of the day at 91 mph. To go along with advanced arm strength, Woodward possesses soft hands and quicker lateral movements than the frame suggests - projecting to be able to stick at 3B at the college level. A 6.90 runner, Kline offers impact on the offensive side of the ball with a very simple swing that allows him to be consistently on-time, along with strength in the barrel due to above-average bat speed and advanced physical strength.
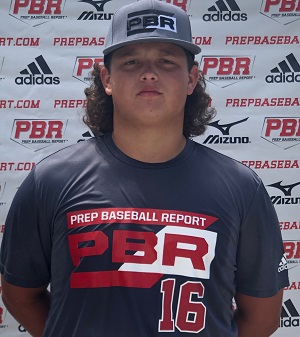
Position Profile: 3B/OF
Body: 6-3, 215-pounds. Sturdy, XL
Hit: RHH. Wide stance, simple setup. Short stride w/ minimal load. Preset weight in the back leg allows for simple operation. Direct path with level barrel. Line drive approach. Strength generates bat speed.
Power: 94 max exit velocity, averaged 86.4 mph. 329' max distance.
Arm: RH. INF-86 mph.Short arm from an OTT slot w/ good strength and carry
Defense: Moves well laterally for his size. Abv avg footwork, soft hands, clean exchange. Chance to stick at 3B at college level
Run: 7.02 runner in the 60.
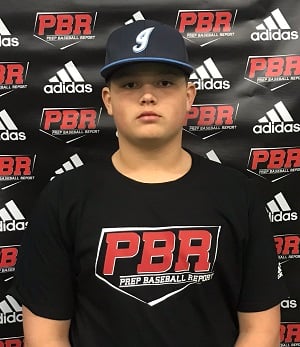
Kline Woodward, Bedford North Lawrence, 2024, IN
Position: 3B/OF
Body: 6-foot-3, 210-pound strong frame.
Hit: (RHH) Solid. Started in a wide stance with a small load, then used a short stride. Quick efficient bat speed. Good extension on his balanced finish, short level swing. Gap to gap approach.
Power: 92.3 mph exit velocity, average 82.0 mph. 67.3 mph bat speed average. 21.7 mph hand speed average.
Defense: (IF) Soft hands, fluid footwork, clean exchange. Solid.
Arm: 86 mph infield velocity. Quick arm action, high ¾ slot.
Run: 6.95
Kline Woodward, Bedford North Lawrence, 2024, IN
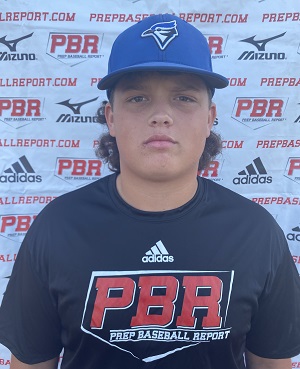
Position: 3B/RHP
Body: 6-foot-3, 210-pound strong frame.
Hit: (RHH) Solid. Began in a wide stance with a small arm bar load, then used a short stride. Quick bat speed. Good extension on his finish, upward swing. Gap to gap aggressive approach.
Power: 94 mph exit velocity, average 76.8 mph. 72.9 mph bat speed average. 22.8 mph hand speed average.
Defense: (IF) Soft hands, quick footwork, twitchy packing exchange. Solid. Movements laterally were quick.
Arm: 88 mph infield velocity. Quick arm action, an-over-the-top slot.
Speed: 6.90 (60-yard).
Pitching: Solid. Feel delivery, high effort. Over-the-top arm angle, quick arm speed, moderate quick arm action. Tall balance point, a clean finish.
FB: 77-80 mph. (Max spin 1812; Avg 1722). Arm side accuracy.
CB: 70 mph. (Max spin 1766; Avg 1766).
CH: 71-73 mph. Feel command, fading action.
SL: 69-70 mph. Tight action. (Max spin 1864; Avg 1808).
Kline Woodward, Bedford North Lawrence, 2024, IN
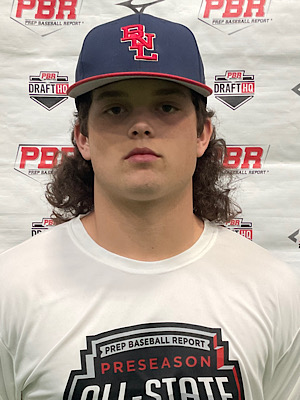
Position: 3B/RHP
Body: 6-foot-3, 210-pound solid projectable build.
Hit: (RHH) Starts in a tall stance with a quick load, then uses a small leg kick. Average bat speed. Uphill swing. Aggressive approach.
Power: 89 mph exit velocity, average 79.37 mph. 60.50 mph bat speed average. 21.28 mph hand speed average.
Defense: (IF) Soft hands, aggressive footwork, clean quick exchange. Above average.
Arm: 83 mph infield velocity. Quick arm action, an-over-the-top slot, consistent accuracy.
Speed: 7.37 (60-yard).
Pitching: Tall-and-fall delivery, some effort. Over-the-top arm angle. Tall balance point.
FB: T79. 77-78 mph. (Max spin 1814; Avg 1634). In the zone accuracy.
CB: In the zone consistent command.
CH: 70-71 mph.
SL: 67-68 mph. (Max spin 1694; Avg 1636).