CLASS OF 2023
SS
2B
Jaden
Correa
John A. Logan JC
De La Salle (HS) • IL
6' 0" • 175LBS
R/R • 18yr 11mo
Travel Team: Top Tier Americans
De La Salle (HS) • IL
6' 0" • 175LBS
R/R • 18yr 11mo
Travel Team: Top Tier Americans
Rankings
2023 National
Rankings available to Premium Subscriber
2023 State
Rankings available to Premium Subscriber
Commitment
Best Of Stats
26.9
Hand Speed (max)
2/26/22
77.6
Bat Speed (max)
2/01/23
25.3
Rot. Acc (max)
2/01/23
-
Hard Hit %
98.6
Exit Velocity (max)
7/28/21
92.5
Exit Velocity (avg)
9/07/23
373
Distance (max)
7/14/21
88
Sweet Spot %
6/21/22
6.83
60
6/21/22
3.85
30-yd
9/07/23
1.66
10-yd
9/07/23
20.3
Run speed (max)
9/07/23
87
INF Velo
2/26/22
-
OF Velo
-
C Velo
-
Pop Time
Positional Tools
2023
2022
2021
60 Yard Dash
The athlete's fastest 60-yard dash time in the given event year. Measured in seconds (s)
6.87
Infield Velocity
The athlete's maximum throwing velocity from an infield position in the given event year. Measured in miles per hour (MPH).
82.0
Power / Speed Score
A simple calculation that divides the athlete’s Exit Velocity Max by the athlete’s 60 Yard Dash time for the given event year. For example, 98 MPH / 7.00s = 14.00.
14.2
60 Yard Dash
The athlete's fastest 60-yard dash time in the given event year. Measured in seconds (s)
6.83
Infield Velocity
The athlete's maximum throwing velocity from an infield position in the given event year. Measured in miles per hour (MPH).
87.0
Power / Speed Score
A simple calculation that divides the athlete’s Exit Velocity Max by the athlete’s 60 Yard Dash time for the given event year. For example, 98 MPH / 7.00s = 14.00.
14.4
60 Yard Dash
The athlete's fastest 60-yard dash time in the given event year. Measured in seconds (s)
7.06
Infield Velocity
The athlete's maximum throwing velocity from an infield position in the given event year. Measured in miles per hour (MPH).
85.0
Power / Speed Score
A simple calculation that divides the athlete’s Exit Velocity Max by the athlete’s 60 Yard Dash time for the given event year. For example, 98 MPH / 7.00s = 14.00.
13.5
Hitting

2023
2022
2021
Exit Velocity Max
The highest exit velocity of any batted ball in the given event year. Measured in miles per hour (MPH).
97.6
Exit Velocity Avg
Average exit velocity of all batted balls in the given event year. Measured in miles per hour (MPH).
92.5
Distance Max
The highest flight distance of any batted ball in the given event year. Measured in feet (ft).
348
Distance Avg
Average flight distance of all batted balls in the given event year. Measured in feet (ft).
225
Launch Angle Avg
Average launch angle of all batted balls in the given event year. Measured in degrees.
14.6
Hard Hit %
Percentage of batted balls with exit velocities over 95 MPH in the given event year.
Sweet Spot %
Percentage of batted balls in the given event year with a launch angle between 8° and 32°.
Line Drive %
Percentage of batted balls with launch angles between 10 and 25 degrees in the given event year.
Fly Ball %
Percentage of batted balls with launch angles between 25 and 50 degrees in the given event year.
Ground Ball %
Percentage of batted balls with launch angles below 10 degrees in the given event year.
Exit Velocity Max
The highest exit velocity of any batted ball in the given event year. Measured in miles per hour (MPH).
98.5
Exit Velocity Avg
Average exit velocity of all batted balls in the given event year. Measured in miles per hour (MPH).
88.3
Distance Max
The highest flight distance of any batted ball in the given event year. Measured in feet (ft).
356
Distance Avg
Average flight distance of all batted balls in the given event year. Measured in feet (ft).
215
Launch Angle Avg
Average launch angle of all batted balls in the given event year. Measured in degrees.
18.2
Hard Hit %
Percentage of batted balls with exit velocities over 95 MPH in the given event year.
Sweet Spot %
Percentage of batted balls in the given event year with a launch angle between 8° and 32°.
Line Drive %
Percentage of batted balls with launch angles between 10 and 25 degrees in the given event year.
Fly Ball %
Percentage of batted balls with launch angles between 25 and 50 degrees in the given event year.
Ground Ball %
Percentage of batted balls with launch angles below 10 degrees in the given event year.
Exit Velocity Max
The highest exit velocity of any batted ball in the given event year. Measured in miles per hour (MPH).
95.0
Exit Velocity Avg
Average exit velocity of all batted balls in the given event year. Measured in miles per hour (MPH).
87.8
Distance Max
The highest flight distance of any batted ball in the given event year. Measured in feet (ft).
373
Distance Avg
Average flight distance of all batted balls in the given event year. Measured in feet (ft).
192
Launch Angle Avg
Average launch angle of all batted balls in the given event year. Measured in degrees.
15.4
Hard Hit %
Percentage of batted balls with exit velocities over 95 MPH in the given event year.
Sweet Spot %
Percentage of batted balls in the given event year with a launch angle between 8° and 32°.
Line Drive %
Percentage of batted balls with launch angles between 10 and 25 degrees in the given event year.
Fly Ball %
Percentage of batted balls with launch angles between 25 and 50 degrees in the given event year.
Ground Ball %
Percentage of batted balls with launch angles below 10 degrees in the given event year.
PBR IL: John A Logan / SIC / Rend Lake / Kaskaskia Scout Day
Sep 7, 2023
Trackman - Hitting
97.6
Exit Velocity (max)
92.5
Exit Velocity (avg)
225
Distance (avg)
348
Distance (max)
Hard Hit %
Sweet Spot %
Line Drive %
Fly Ball %
Ground Ball %
Preseason ProCase (Invite-Only)
Feb 1, 2023
Trackman - Hitting
96.8
Exit Velocity (max)
90.7
Exit Velocity (avg)
303
Distance (avg)
370
Distance (max)
Hard Hit %
Sweet Spot %
Line Drive %
Fly Ball %
PBR ProCase - Midwest (Invite-Only)
Jun 21, 2022
Trackman - Hitting
98.5
Exit Velocity (max)
88.1
Exit Velocity (avg)
251
Distance (avg)
356
Distance (max)
Hard Hit %
Sweet Spot %
Line Drive %
Fly Ball %
Ground Ball %
Preseason All-State: Upperclass (Invite-Only)
Feb 26, 2022
Trackman - Hitting
94.5
Exit Velocity (max)
88.7
Exit Velocity (avg)
160
Distance (avg)
341
Distance (max)
Hard Hit %
Sweet Spot %
Line Drive %
Fly Ball %
Ground Ball %
IL/IN/IA/WI Workout Pod
Jul 28, 2021
Trackman - Hitting
98.6
Exit Velocity (max)
85.9
Exit Velocity (avg)
246
Distance (avg)
354
Distance (max)
Hard Hit %
Sweet Spot %
Line Drive %
Fly Ball %
Ground Ball %
2021 Future Games
Jul 28, 2021
Trackman - Hitting
98.6
Exit Velocity (max)
85.9
Exit Velocity (avg)
246
Distance (avg)
354
Distance (max)
Hard Hit %
Sweet Spot %
Line Drive %
Fly Ball %
Ground Ball %
Class of 2023 Showcase
Jul 14, 2021
Trackman - Hitting
95.0
Exit Velocity (max)
87.8
Exit Velocity (avg)
192
Distance (avg)
373
Distance (max)
Hard Hit %
Sweet Spot %
Line Drive %
Fly Ball %
Ground Ball %
Hitting

2023
2022
2021
Hand Speed Max
The highest Peak Hand Speed of any swing in the given event year.
25.4
Hand Speed Avg
The average Peak Hand Speed for all swings in the given event year.
23.5
Bat Speed Max
The highest Bat Speed of any swing in the given event year.
75.1
Bat Speed Avg
The average Bat Speed for all swings in the given event year.
73.5
Rotational Acceleration Max
The highest Rotational Acceleration of any swing in the given event year.
Rotational Acceleration Avg
The average Rotational Acceleration for all swings in the given event year.
On-Plane Efficiency Max
The highest On-Plane Efficiency of any swing in the given event year.
On-Plane Efficiency Avg
The average On-Plane Efficiency for all swings in the given event year.
Hand Speed Max
The highest Peak Hand Speed of any swing in the given event year.
26.9
Hand Speed Avg
The average Peak Hand Speed for all swings in the given event year.
24.8
Bat Speed Max
The highest Bat Speed of any swing in the given event year.
75.3
Bat Speed Avg
The average Bat Speed for all swings in the given event year.
69.4
Rotational Acceleration Max
The highest Rotational Acceleration of any swing in the given event year.
Rotational Acceleration Avg
The average Rotational Acceleration for all swings in the given event year.
On-Plane Efficiency Max
The highest On-Plane Efficiency of any swing in the given event year.
On-Plane Efficiency Avg
The average On-Plane Efficiency for all swings in the given event year.
Hand Speed Max
The highest Peak Hand Speed of any swing in the given event year.
26.2
Hand Speed Avg
The average Peak Hand Speed for all swings in the given event year.
23.9
Bat Speed Max
The highest Bat Speed of any swing in the given event year.
76.2
Bat Speed Avg
The average Bat Speed for all swings in the given event year.
70.0
Rotational Acceleration Max
The highest Rotational Acceleration of any swing in the given event year.
Rotational Acceleration Avg
The average Rotational Acceleration for all swings in the given event year.
On-Plane Efficiency Max
The highest On-Plane Efficiency of any swing in the given event year.
On-Plane Efficiency Avg
The average On-Plane Efficiency for all swings in the given event year.
PBR IL: John A Logan / SIC / Rend Lake / Kaskaskia Scout Day
Sep 7, 2023
Blast - Hitting
25.4
Hand Speed (max)
23.5
Hand Speed (avg)
75.1
Bat Speed (max)
73.5
Bat Speed (avg)
Rot. Acc (max)
Rot. Acc (avg)
On Plane Eff (avg)
MaxOnPlaneEfficiency
Preseason ProCase (Invite-Only)
Feb 1, 2023
Blast - Hitting
26.0
Hand Speed (max)
24.2
Hand Speed (avg)
77.6
Bat Speed (max)
73.2
Bat Speed (avg)
Rot. Acc (max)
Rot. Acc (avg)
On Plane Eff (avg)
MaxOnPlaneEfficiency
PBR ProCase - Midwest (Invite-Only)
Jun 21, 2022
Blast - Hitting
26.6
Hand Speed (max)
24.6
Hand Speed (avg)
72.9
Bat Speed (max)
67.8
Bat Speed (avg)
Rot. Acc (max)
Rot. Acc (avg)
On Plane Eff (avg)
MaxOnPlaneEfficiency
Preseason All-State: Upperclass (Invite-Only)
Feb 26, 2022
Blast - Hitting
26.9
Hand Speed (max)
25.0
Hand Speed (avg)
75.3
Bat Speed (max)
71.7
Bat Speed (avg)
Rot. Acc (max)
Rot. Acc (avg)
On Plane Eff (avg)
MaxOnPlaneEfficiency
IL/IN/IA/WI Workout Pod
Jul 28, 2021
Blast - Hitting
26.2
Hand Speed (max)
24.4
Hand Speed (avg)
76.2
Bat Speed (max)
70.3
Bat Speed (avg)
Rot. Acc (max)
Rot. Acc (avg)
On Plane Eff (avg)
2021 Future Games
Jul 28, 2021
Blast - Hitting
26.2
Hand Speed (max)
24.4
Hand Speed (avg)
76.2
Bat Speed (max)
70.3
Bat Speed (avg)
Rot. Acc (max)
Rot. Acc (avg)
On Plane Eff (avg)
MaxOnPlaneEfficiency
Class of 2023 Showcase
Jul 14, 2021
Blast - Hitting
24.3
Hand Speed (max)
23.5
Hand Speed (avg)
72.5
Bat Speed (max)
69.8
Bat Speed (avg)
Rot. Acc (max)
Rot. Acc (avg)
On Plane Eff (avg)
MaxOnPlaneEfficiency
Pitching

Pitch Scores
Pitching Velos
Game Performance

2023
2022
10 Yard Dash
The athlete's fastest 0-10-yard split time in the given event year. Measured in seconds.
1.66
30 Yard Dash
The athlete's fastest 0-30-yard split time in the given event year. Measured in seconds.
3.85
60 Yard Dash
The athlete's fastest 0-60-yard time in the given event year. Measured in seconds.
6.87
Top Speed (MPH)
The athlete's fastest split time converted to miles per hour.
RSi
The reactive strength index measurement of an athlete's explosiveness by comparing their jump height to the ground contact time in between their jumps. On a scale of 0-5.
Preseason ProCase (Invite-Only)
Feb 1, 2023
Swift
1.72
10-yd
3.84
30-yd
6.87
60-yd
20.3
Run speed (max)
0.92
RSi (max)
0.92
RSi (avg)
1,709
Jump Power (max)
29.6
Jump Height (max)
29.2
Jump Height (avg)
PBR ProCase - Midwest (Invite-Only)
Jun 21, 2022
Swift
1.71
10-yd
3.87
30-yd
6.83
60-yd
20.7
Run speed (max)
8.8
Run Speed (avg)
1.13
RSi (max)
0.92
RSi (avg)
1,649
Jump Power (max)
28.4
Jump Height (max)
26.4
Jump Height (avg)
Visual Edge

2023
2022
2021
Edge Score
The highest Edge Score within the given year. Edge Score is a comprehensive score that takes the core-six visual skills into account, providing an assessment of an athlete’s overall visual ability.
78.33
Edge Score
The highest Edge Score within the given year. Edge Score is a comprehensive score that takes the core-six visual skills into account, providing an assessment of an athlete’s overall visual ability.
76.68
Edge Score
The highest Edge Score within the given year. Edge Score is a comprehensive score that takes the core-six visual skills into account, providing an assessment of an athlete’s overall visual ability.
67.27
Pitch Ai

Notes
News
- PBR IL: John A. Logan / SIC / Rend Lake / Kaskaskia, Takeaways - Sep 14, 2023
- Week 7 Diamond Notes - May 5, 2023
- Week 2 Games - Mar 27, 2023
- Preseason All-State, Upperclass: Preview - Feb 24, 2023
- PBR Preseason ProCase: All Player Analysis - Feb 3, 2023
- Preseason All-State Upperclass: Infield Analysis - Jul 7, 2022
- Midwest ProCase - Event Analysis - Jun 28, 2022
- Midwest Premier Super 17 (Member): Preview Story - Jun 22, 2022
- PBR ProCase - Midwest: Preview Story - Jun 16, 2022
- Preseason All-State: Upperclass Blast Motion Board - Mar 7, 2022
- Preseason All-State: Upperclass Quick Hits - Mar 3, 2022
- IL Preseason All-State - Upperclass: Preview - Feb 23, 2022
- Best of 2021: Max Infield Velocity Leaders - Jan 21, 2022
- Best of 2021: Max Exit Velocity Leaders - Jan 11, 2022
- Class of 2023 Showcase: Position Player Analysis - Nov 24, 2021
- Illinois Class of 2023 Rankings: Newcomers - Sep 9, 2021
- 2021 Future Games: College Commitment Tracker - Aug 3, 2021
Comments
Draft Reports
Contact
Premium Content Area
To unlock contact information, you need to purchase a ScoutPLUS subscription.
Purchase Subscription OR
Login

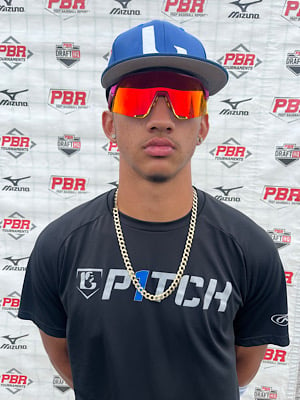






 Sign in to view rankings
Jaden Correa, MIF, De LaSalle (IL), 2023
True freshman. 6-foot, 175-pounds, lean strength with room for added muscle as he matures. Athletic infield profile, showcasing smooth actions and soft hands up the middle. Above-average foot speed with range to both sides of the glove (6.87 60-yard dash). Present strength in his right-handed stroke with a high likelihood of more to come, reaching up to 97.6 mph for his max EV with an average of 92.5 mph. He also put up impressive BLAST metrics, averaging 23.5 mph for his hand-speed (T25.4 mph).
Verbally committed to John A. Logan JC.
Nebraska commit. The Meteors went 4-0 on the week and Correa was a major factor in their wins. On the week he went 9-for-13 (.692 BA/.706 OBP/2.167 OPS) with two home runs, four doubles, and seven RBIs. In their 9-5 win over Thornwood, Correa went a perfect 2-for-2 with a home run, two RBIs, three runs scored and two walks. He went a perfect 4-for-4 with two doubles, three RBIs, two runs scored and a stolen base in their 13-2 win over Leo. Correa hit another home run in their 4-3 win over St. Ignatius with an RBI, run scored and a walk.
Nebraska commit. Currently ranked No. 29 in the state. 6-foot, 175-pounds, lean, athletic build with plenty more room for physical development. Batted second and played shortstop. Created havoc on the bases, stealing two on the day. Right-handed hitter stands in the box with a wide stance, fluid rhythm throughout the swing, and a small stride timing trigger. Quick, athletic hands created whip while controlling the barrel with a gap to gap approach. In his first at-bat of the night, Correa drove a double to the right center gap. Ended the day going 2-for-3 and stole third base twice.
Positional Profile: SS/2B
Body: 6-0, 175-pounds. Lean, athletic, loose frame with more room to fill out.
Hit: RHH. Wide base, relaxed setup, fluid load and quiet heel-lift stride. Quick, athletic, loose hands, sneaky jump off the barrel, natural lift in swing and pull-side approach.
Power: 97 max exit velocity, averaged 90.7 mph. 370’ max distance.
Arm: RH. INF - 85 mph. Short, clean arm action, can throw from multiple slots and throws play true with occasional carry.
Defense: Fluid footwork and actions, plays through the ball with timing and rhythm, clean release and comfortable on the move. Soft, sure hands, plays out in front.
Run: 6.87 runner in the 60.
Positional Profile: SS/2B
Body: 6-1, 176-pounds. Wiry athletic build. Long limbs.
Hit: RHH. Tall, even setup. Closed, quick stride. Hands even with ears. Loose swing. Controlled the barrel with line drives to all fields.
Power: 98.5 max exit velocity, averaged 88.1 mph. 356’ max distance.
Arm: RH. INF - 82 mph. Short repeatable arm action, played average. Accuracy/carry to bag. 3/4 slot.
Defense: Athletic actions, quick feet.
Run: 6.83 runner in the 60. Upright runner.
Nebraska commit, currently ranked No. 25 in the Illinois’ 2023 class. 6-foot, 176-pound, loose, athletically-built, right-handed hitting shortstop. Got things started for the Meteors with a two-run home run over the right-field fence in the first inning. Also, delivered a two-run double in his last at-bat of the day. Stands in the box with confidence and moxy. Loose, athletic swing, stays through the zone and shows sneaky pop to all fields. Defensively, has highly-athletic actions, soft hands and a strong arm that plays with easy carry. One of the top middle infield prospects in the class.
Positional Profile: SS/2B
Body: 6-0, 176-pounds.
Hit: RHH. Confident and athletic look in the box. Fluid rhythm. Quick, athletic hands. Bat speed. Ability to cover the plate and use the whole field. Elevated hard pull-side contact at times.
Power: 94.5 max exit velocity, averaged 88.7 mph. 341’ max distance.
Arm: RH. INF - 87 mph. Short draw out of the glove. Clean arm action, works from a 3/4 slot, ball explodes out of the hand with carry, plays on the move from multiple slots.
Defense: Soft hands, athletic and balanced footwork, loose actions.
Run: 7.01 runner in the 60.
Correa offers all kinds of rhythm, athleticism and whip in his right-handed swing with upside. The Nebraska recruit was inconsistent at times, but the ball jumps off the barrel to both gaps when he syncs up and is on time. Correa is also one of the more action-y defenders in attendance, playing with confidence and high-level feet. He ran a 7.01 in the 60 and topped at 87 mph across the infield.
In the summer, back at The Rock Complex coincidentally, Correa took the tournament by storm with his flashy athleticism and twitchy right-handed swing that generated some loud, far contact. He did more of the same this past weekend, and continues to show as one of Illinois’ most athletic uncommitted prospects.
Positional Profile: SS/2B
Body: 6-foot, 176-pounds. Athletic, strong build.
Hit: RHH. Simple, balanced stance, smooth weight transfer, short stride. Quick, athletic hands, short to the baseball, uses the whole field.
Power: 94.97 max exit velocity, averaged 87.83 mph. 372’ max distance.
Arm: RH. INF - 85 mph. Short, loose arm action, high 3/4 slot, throws play with life.
Defense: Natural movements to the baseball, fields out in front, soft hands, clean exchange.
Run: 7.13 runner in the 60.