CLASS OF 2023
C
OF
Drew
Charney
Butler
Hopkins (HS) • MN
5' 10" • 205LBS
R/R • 20yr 1mo
Travel Team: NorthStar Baseball Club
Hopkins (HS) • MN
5' 10" • 205LBS
R/R • 20yr 1mo
Travel Team: NorthStar Baseball Club
Rankings
2023 National
Rankings available to Premium Subscriber
2023 State
Rankings available to Premium Subscriber
Commitment
Best Of Stats
23.5
Hand Speed (max)
3/20/22
79.7
Bat Speed (max)
3/13/21
13
Rot. Acc (max)
3/13/21
100
Hard Hit %
6/30/21
97.5
Exit Velocity (max)
7/28/21
93.3
Exit Velocity (avg)
6/30/21
384
Distance (max)
7/28/21
57
Sweet Spot %
3/13/21
6.98
60
6/30/21
-
30-yd
-
10-yd
-
Run speed (max)
86
INF Velo
6/17/20
94
OF Velo
6/30/21
80
C Velo
6/30/21
1.90 - 2.08
Pop Time
3/08/20
Positional Tools
2022
2021
2020
60 Yard Dash
The athlete's fastest 60-yard dash time in the given event year. Measured in seconds (s)
7.26
Pop Time
The athlete's fastest pop time in the given event year. Measured from glove to glove, in seconds (s).
1.94 - 2.09
Catcher Velocity
The athlete's maximum throwing velocity from the catcher position in the given event year. Measured in miles per hour (MPH).
80.0
Outfield Velocity
The athlete's maximum throwing velocity from an outfield position in the given event year. Measured in miles per hour (MPH).
91.0
Power / Speed Score
A simple calculation that divides the athlete’s Exit Velocity Max by the athlete’s 60 Yard Dash time for the given event year. For example, 98 MPH / 7.00s = 14.00.
13.2
60 Yard Dash
The athlete's fastest 60-yard dash time in the given event year. Measured in seconds (s)
6.98
Pop Time
The athlete's fastest pop time in the given event year. Measured from glove to glove, in seconds (s).
1.90 - 2.13
Catcher Velocity
The athlete's maximum throwing velocity from the catcher position in the given event year. Measured in miles per hour (MPH).
80.0
Outfield Velocity
The athlete's maximum throwing velocity from an outfield position in the given event year. Measured in miles per hour (MPH).
94.0
Power / Speed Score
A simple calculation that divides the athlete’s Exit Velocity Max by the athlete’s 60 Yard Dash time for the given event year. For example, 98 MPH / 7.00s = 14.00.
13.9
60 Yard Dash
The athlete's fastest 60-yard dash time in the given event year. Measured in seconds (s)
7.10
Pop Time
The athlete's fastest pop time in the given event year. Measured from glove to glove, in seconds (s).
1.90 - 2.20
Catcher Velocity
The athlete's maximum throwing velocity from the catcher position in the given event year. Measured in miles per hour (MPH).
78.0
Infield Velocity
The athlete's maximum throwing velocity from an infield position in the given event year. Measured in miles per hour (MPH).
86.0
Power / Speed Score
A simple calculation that divides the athlete’s Exit Velocity Max by the athlete’s 60 Yard Dash time for the given event year. For example, 98 MPH / 7.00s = 14.00.
13.1
PBR MN Underclass Prospect Games (2023 Grads)
Jun 30, 2021
Position
6.98
60-yard
1.96 - 2.05
Pop Time
94
OF Velo
80
C Velo
97
Exit Velo
Power Speed Score
PBR MN Preseason Underclass (Invite Only)
Mar 13, 2021
Position
7.34
60-yard
1.90 - 2.13
Pop Time
91
OF Velo
78
C Velo
97
Exit Velo
Power Speed Score
Hitting

2022
2021
Exit Velocity Max
The highest exit velocity of any batted ball in the given event year. Measured in miles per hour (MPH).
95.9
Exit Velocity Avg
Average exit velocity of all batted balls in the given event year. Measured in miles per hour (MPH).
91.9
Distance Max
The highest flight distance of any batted ball in the given event year. Measured in feet (ft).
318
Distance Avg
Average flight distance of all batted balls in the given event year. Measured in feet (ft).
147
Launch Angle Avg
Average launch angle of all batted balls in the given event year. Measured in degrees.
8.5
Hard Hit %
Percentage of batted balls with exit velocities over 95 MPH in the given event year.
Sweet Spot %
Percentage of batted balls in the given event year with a launch angle between 8° and 32°.
Line Drive %
Percentage of batted balls with launch angles between 10 and 25 degrees in the given event year.
Fly Ball %
Percentage of batted balls with launch angles between 25 and 50 degrees in the given event year.
Ground Ball %
Percentage of batted balls with launch angles below 10 degrees in the given event year.
Exit Velocity Max
The highest exit velocity of any batted ball in the given event year. Measured in miles per hour (MPH).
97.0
Exit Velocity Avg
Average exit velocity of all batted balls in the given event year. Measured in miles per hour (MPH).
86.8
Distance Max
The highest flight distance of any batted ball in the given event year. Measured in feet (ft).
347
Distance Avg
Average flight distance of all batted balls in the given event year. Measured in feet (ft).
250
Launch Angle Avg
Average launch angle of all batted balls in the given event year. Measured in degrees.
26.5
Hard Hit %
Percentage of batted balls with exit velocities over 95 MPH in the given event year.
Sweet Spot %
Percentage of batted balls in the given event year with a launch angle between 8° and 32°.
Line Drive %
Percentage of batted balls with launch angles between 10 and 25 degrees in the given event year.
Fly Ball %
Percentage of batted balls with launch angles between 25 and 50 degrees in the given event year.
Ground Ball %
Percentage of batted balls with launch angles below 10 degrees in the given event year.
PBR MN Preseason All-State: 2023 Grads (Invite Only)
Mar 20, 2022
Trackman - Hitting
95.9
Exit Velocity (max)
91.9
Exit Velocity (avg)
147
Distance (avg)
318
Distance (max)
Hard Hit %
Sweet Spot %
Line Drive %
Fly Ball %
Ground Ball %
2021 Future Games
Jul 28, 2021
Trackman - Hitting
97.5
Exit Velocity (max)
91.2
Exit Velocity (avg)
310
Distance (avg)
384
Distance (max)
Hard Hit %
Sweet Spot %
Line Drive %
Fly Ball %
Ground Ball %
IL/IN/IA/WI Workout Pod
Jul 28, 2021
Trackman - Hitting
97.5
Exit Velocity (max)
91.2
Exit Velocity (avg)
310
Distance (avg)
384
Distance (max)
Hard Hit %
Sweet Spot %
Line Drive %
Fly Ball %
Ground Ball %
PBR MN Underclass Prospect Games (2023 Grads)
Jun 30, 2021
Trackman - Hitting
97.0
Exit Velocity (max)
93.3
Exit Velocity (avg)
241
Distance (avg)
325
Distance (max)
Hard Hit %
Sweet Spot %
Line Drive %
Fly Ball %
Ground Ball %
PBR MN Preseason Underclass (Invite Only)
Mar 13, 2021
Trackman - Hitting
90.7
Exit Velocity (max)
81.3
Exit Velocity (avg)
258
Distance (avg)
347
Distance (max)
Hard Hit %
Sweet Spot %
Line Drive %
Fly Ball %
PBR MN Underclass Prospect Games- 2023 Grads (Invite Only)
Jun 17, 2020
Trackman - Hitting
97.5
Exit Velocity (max)
89.3
Exit Velocity (avg)
211
Distance (avg)
333
Distance (max)
Hard Hit %
Line Drive %
Fly Ball %
Ground Ball %
Hitting

2022
2021
Hand Speed Max
The highest Peak Hand Speed of any swing in the given event year.
23.5
Hand Speed Avg
The average Peak Hand Speed for all swings in the given event year.
23.2
Bat Speed Max
The highest Bat Speed of any swing in the given event year.
75.0
Bat Speed Avg
The average Bat Speed for all swings in the given event year.
73.2
Rotational Acceleration Max
The highest Rotational Acceleration of any swing in the given event year.
Rotational Acceleration Avg
The average Rotational Acceleration for all swings in the given event year.
On-Plane Efficiency Max
The highest On-Plane Efficiency of any swing in the given event year.
On-Plane Efficiency Avg
The average On-Plane Efficiency for all swings in the given event year.
Hand Speed Max
The highest Peak Hand Speed of any swing in the given event year.
23.3
Hand Speed Avg
The average Peak Hand Speed for all swings in the given event year.
21.5
Bat Speed Max
The highest Bat Speed of any swing in the given event year.
79.7
Bat Speed Avg
The average Bat Speed for all swings in the given event year.
73.3
Rotational Acceleration Max
The highest Rotational Acceleration of any swing in the given event year.
Rotational Acceleration Avg
The average Rotational Acceleration for all swings in the given event year.
On-Plane Efficiency Max
The highest On-Plane Efficiency of any swing in the given event year.
On-Plane Efficiency Avg
The average On-Plane Efficiency for all swings in the given event year.
PBR MN Preseason All-State: 2023 Grads (Invite Only)
Mar 20, 2022
Blast - Hitting
23.5
Hand Speed (max)
23.2
Hand Speed (avg)
75.0
Bat Speed (max)
73.2
Bat Speed (avg)
Rot. Acc (max)
Rot. Acc (avg)
On Plane Eff (avg)
MaxOnPlaneEfficiency
2021 Future Games
Jul 28, 2021
Blast - Hitting
22.3
Hand Speed (max)
20.6
Hand Speed (avg)
77.9
Bat Speed (max)
72.9
Bat Speed (avg)
Rot. Acc (max)
Rot. Acc (avg)
On Plane Eff (avg)
MaxOnPlaneEfficiency
IL/IN/IA/WI Workout Pod
Jul 28, 2021
Blast - Hitting
22.3
Hand Speed (max)
20.6
Hand Speed (avg)
77.9
Bat Speed (max)
72.9
Bat Speed (avg)
Rot. Acc (max)
Rot. Acc (avg)
On Plane Eff (avg)
PBR MN Underclass Prospect Games (2023 Grads)
Jun 30, 2021
Blast - Hitting
23.3
Hand Speed (max)
22.5
Hand Speed (avg)
75.1
Bat Speed (max)
72.8
Bat Speed (avg)
Rot. Acc (max)
Rot. Acc (avg)
On Plane Eff (avg)
MaxOnPlaneEfficiency
PBR MN Preseason Underclass (Invite Only)
Mar 13, 2021
Blast - Hitting
21.9
Hand Speed (max)
21.6
Hand Speed (avg)
79.7
Bat Speed (max)
74.3
Bat Speed (avg)
Rot. Acc (max)
Rot. Acc (avg)
On Plane Eff (avg)
MaxOnPlaneEfficiency
PBR MN Underclass Prospect Games- 2023 Grads (Invite Only)
Jun 17, 2020
Blast - Hitting
20.7
Hand Speed (max)
20.2
Hand Speed (avg)
78.2
Bat Speed (max)
74.2
Bat Speed (avg)
Rot. Acc (max)
Rot. Acc (avg)
On Plane Eff (avg)
Pitching

Pitch Scores
Pitching Velos
Game Performance

Visual Edge

2021
Edge Score
The highest Edge Score within the given year. Edge Score is a comprehensive score that takes the core-six visual skills into account, providing an assessment of an athlete’s overall visual ability.
63.97
Pitch Ai

Notes
News
- Creekside Summer Championships (6/16-6/19): Scout Blog - Jun 18, 2022
- PBR MN Preseason All-State: Scouting Reports- Outfielders - Apr 26, 2022
- PBR MN Preseason All-State: Scouting Reports- Catchers - Apr 25, 2022
- PBR Minnesota 2022 High School Preview: Hopkins Royals - Apr 2, 2022
- PBR MN Preseason All-State: Event Preview - Mar 17, 2022
- PBR MN- Top 10 Most Viewed Profiles of 2021- #9 - Dec 21, 2021
- PBR MN Underclass Games (2023 Grads)- Catcher Evaluations - Aug 9, 2021
- 2021 Future Games: College Commitment Tracker - Aug 3, 2021
- PBR MN Underclass Prospect Games (2023 Grads): Trackman & Blast Hitting Leaderboards - Jul 15, 2021
- PBR MN Underclass Prospect Games (2023 Grads): Instant Analysis - Jul 1, 2021
- PBR MN- Top Blast Hitting Metrics Of 2020 (Part One) - Nov 25, 2020
- PBR MN- Top Trackman Hitting Metrics Of 2020 (Part Two) - Nov 24, 2020
- PBR MN- Top Trackman Hitting Metrics Of 2020 (Part One) - Nov 23, 2020
- PBR MN- Top Catcher Velo & Pop Times Of 2020 - Nov 20, 2020
- PBR MN- Top Infield Velocities Of 2020 - Nov 18, 2020
- PBR MN- Top Exit Velocities Of 2020 - Nov 17, 2020
- PBR MN- Top 60 Yard Dashes Of 2020 - Nov 16, 2020
- PBR MN Underclass Prospect (2023 Grads)- Infielder Evaluations - Jul 29, 2020
- PBR MN Underclass Prospect (2023 Grads): Catcher Evaluations - Jul 27, 2020
- PBR MN Underclass- 2023 Grads- Instant Analysis - Jun 19, 2020
- Just Missed 2023 Position Players - May 21, 2020
- Top 2023 Catchers - May 13, 2020
- PBR MN Preseason Underclass: Top Prospects - Apr 3, 2020
- PBR MN Preseason Underclass: Infielder Evaluations - Apr 1, 2020
- PBR MN Preseason Underclass: Catcher Evaluations - Mar 30, 2020
Comments
Draft Reports
Contact
Premium Content Area
To unlock contact information, you need to purchase a ScoutPLUS subscription.
Purchase Subscription OR
Login

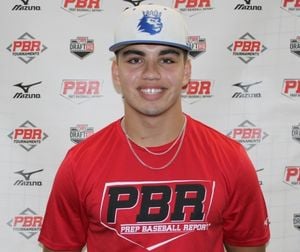
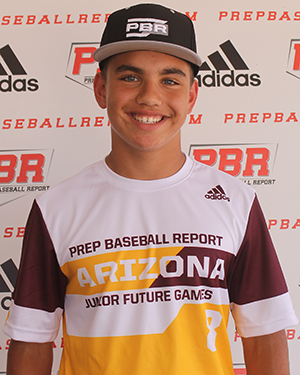
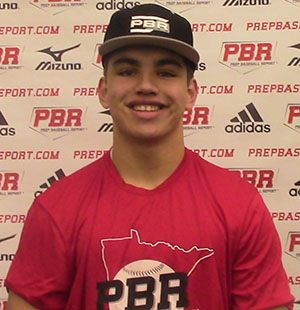

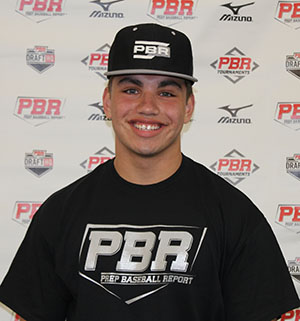




 Sign in to view rankings
Positional Profile: C/OF - Ranked 9th in MN 2023 class / Butler commit
Body: 5-11, 190-pounds. - Strength in frame
Hit: RHH. Balanced stance. Rhythm in load. Aggressive swing and showed bat speed. Middle approach with mostly ground ball contact. Flashed pull pop.
Power: 95.9 max exit velocity, averaged 91.9 mph. 317’ max distance.
Arm: RH. C - 80 mph. OF - 91 mph.
Defense: C - Shows good balance and athleticism. Stays behind the ball with a good strong glove. Clean and quick exchange with good footwork. 1.94-2.09 pop times. OF - Aggressive feet and work with release. Good glove
Run: 7.26 runner in the 60.
Positional Profile: C/OF
Body: 5-10, 192-pounds. Strong, stocky build.
Defense: 1.96-2.03 pop times. C - One knee setup, some stiffness in movements. Strong glove, holds velo and movement well. Works hard on blocks, deadens well. Present arm strength. OF - Feet position well to work through hops. Long release and arm action, + current arm strength.
Arm: R. C - 80 mph. OF - 94 mph.
Hit: RHH. Balanced setup, toe tap load. Maintains leverage through rotation. Flashes power potential. Above avg. barrel speed w/ gap to gap LD contact.
Power: 97 mph exit velocity from the tee.
Run: 6.98 runner in the 60.
Positional Profile: C/OF
Body: 5-foot-10, 192-pounds. - Strong frame
Defense: Strong base. Glove works low to high, can be hard. Average movements to block. Clean exchange and longer footwork onthrows. 1.90-2.13 pop times. OF- Average feet to field and long through release. Average glove.
Arm: Right. C - 78 mph. OF - 91 mph. Above average carry and average accuracy
Hit: Right. Balanced start. Small leg lift. Looks to lift, some push to barrel. Middle approach and flashed pop in barrel
Power: 97 mph exit velocity from the tee.
Run: 7.34 runner in the 60.
Position: C/3B
Body: 5-foot-9, 192-pound physical frame
Hit: Starts in an athletic balanced stance with a small load, then uses a quick stride. Above average bat speed.
Power: 93 mph exit velocity. Gap to gap approach.
Defense: Catcher- Consistent hands, quick footwork, quick exchange. Athletic setup. Consistent hands, quick footwork, quick exchange. Infield- Sure hands, quick footwork. Laterally, his movements were athletic.
Arm: 86 mph Infield velocity. 78 mph Catcher Velocity. 2.03-2.20 pop times. Long arm action, decent accuracy.
Speed: 7.10
Positional Profile: C/3B
Body: 5-9, 192-pounds. Strong build
Hit: RHH. Balanced stance with high handset. Leg lift and hand load down. Aggressive swing.Mid/pull approach with line drive and fly ball contact.
Power: 90 mph exit velocity from the tee. Strong consistent contact
Arm: RH. C - 76 mph. INF - 85 mph. Short whippy arm action
Defense: 1.90-2.08 pop times. Good exchange and footwork. Offset stance. Good glove and works the zone.Average to block.
IF Arm: RH. C - 76 mph. INF - 85 mph. Two part arm action with carry
IF Defense: Active feet and late to field position. Hands come out with feet and can be late
Run: 7.51 runner in the 60.