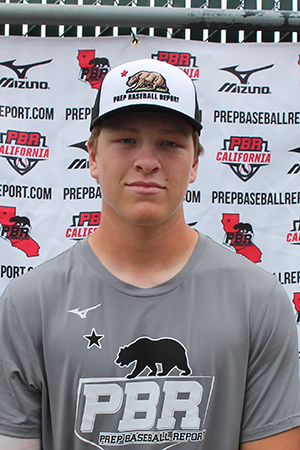
Uncommitted Spotlight: Connor "Bear" Harrison
January 23, 2023
Connor Harrison
Class of 2023 / C
Rankings
StateRank: 188 / POS: 21
Player Information
-
Graduating Class: 2023
-
Primary Position: CSecondary Position: RHP
-
High School: De La SalleState: CA
- Summer Team: Trosky National Team 2023
-
Height: 6-3Weight: 210lbs
- Bat/Throw: R/R
Statistics
Position
7.69
60-yard
(09/17/22)
1.99 - 2.04
Pop Time
(09/18/21)
81
INF Velo
(06/05/22)
74
C Velo
(06/05/22)
92
Exit Velo
(09/18/21)
Power Speed Score
(06/05/22)

Trackman - Hitting
97.0
Exit Velocity (max)
(06/05/22)
92.4
Exit Velocity (avg)
(09/17/22)
325
Distance (avg)
(09/17/22)
377
Distance (max)
(09/17/22)
Hard Hit %
(09/17/22)
Sweet Spot %
(09/17/22)
Line Drive %
(01/09/22)
Fly Ball %
(09/17/22)
Ground Ball %
(01/09/22)
BAWS Uncommitted 2022
Sep 17, 2022
Trackman - Hitting
Exit Velocity (max)
96.9
Exit Velocity (avg)
92.4
Distance (avg)
325
Distance (max)
377
Hard Hit %
Sweet Spot %
Line Drive %
Fly Ball %
2022 NorCal ProCase (INVITE ONLY)
Jun 5, 2022
Trackman - Hitting
Exit Velocity (max)
97
Exit Velocity (avg)
86.6
Distance (avg)
274
Distance (max)
345
Hard Hit %
Sweet Spot %
Line Drive %
Fly Ball %
Ground Ball %
SoCal Preseason All-State Upperclass
Jan 9, 2022
Trackman - Hitting
Exit Velocity (max)
88.2
Exit Velocity (avg)
76.7
Distance (avg)
162
Distance (max)
273
Sweet Spot %
Line Drive %
Fly Ball %
Ground Ball %
SoCal Upperclass Games (Invite-Only)
Sep 18, 2021
Trackman - Hitting
Exit Velocity (max)
91.7
Exit Velocity (avg)
84.4
Distance (avg)
234
Distance (max)
338
Hard Hit %
Sweet Spot %
Line Drive %
Fly Ball %
Ground Ball %
Northern CA Underclass
Jun 6, 2020
Trackman - Hitting
Exit Velocity (max)
89.3
Exit Velocity (avg)
63.7
Distance (avg)
156
Distance (max)
249
Sweet Spot %
Line Drive %
Fly Ball %
Ground Ball %

Blast - Hitting
24.4
Hand Speed (max)
(09/17/22)
23.1
Hand Speed (avg)
(09/17/22)
77.1
Bat Speed (max)
(09/17/22)
74.8
Bat Speed (avg)
(09/17/22)
Rot. Acc (max)
(09/18/21)
Rot. Acc (avg)
(01/09/22)
On Plane Eff (avg)
(09/18/21)
MaxOnPlaneEfficiency
(09/18/21)
BAWS Uncommitted 2022
Sep 17, 2022
Blast - Hitting
Hand Speed (max)
24.4
Hand Speed (avg)
23.1
Bat Speed (max)
77.1
Bat Speed (avg)
74.8
Rot. Acc (max)
Rot. Acc (avg)
On Plane Eff (avg)
MaxOnPlaneEfficiency
2022 NorCal ProCase (INVITE ONLY)
Jun 5, 2022
Blast - Hitting
Hand Speed (max)
21.5
Hand Speed (avg)
19.2
Bat Speed (max)
73.8
Bat Speed (avg)
71.3
Rot. Acc (max)
Rot. Acc (avg)
On Plane Eff (avg)
MaxOnPlaneEfficiency
SoCal Preseason All-State Upperclass
Jan 9, 2022
Blast - Hitting
Hand Speed (max)
21.3
Hand Speed (avg)
20.1
Bat Speed (max)
71.8
Bat Speed (avg)
66.7
Rot. Acc (max)
Rot. Acc (avg)
On Plane Eff (avg)
MaxOnPlaneEfficiency
SoCal Upperclass Games (Invite-Only)
Sep 18, 2021
Blast - Hitting
Hand Speed (max)
22.6
Hand Speed (avg)
20.8
Bat Speed (max)
76.1
Bat Speed (avg)
72.3
Rot. Acc (max)
Rot. Acc (avg)
On Plane Eff (avg)
MaxOnPlaneEfficiency
Northern CA Underclass
Jun 6, 2020
Blast - Hitting
Hand Speed (max)
20.1
Hand Speed (avg)
18.8
Bat Speed (max)
70.3
Bat Speed (avg)
65.5
Rot. Acc (max)
Rot. Acc (avg)
On Plane Eff (avg)
Swift
Swift
1.77
10-yd
(06/05/22)
4.13
30-yd
(06/05/22)
7.50
60-yd
(06/05/22)
18.2
Run speed (max)
(06/05/22)
8.0
Run Speed (avg)
(06/05/22)
1768
Jump Power (max)
(06/05/22)
23.9
Jump Height (max)
(06/05/22)
18.3
Jump Height (avg)
(06/05/22)
2022 NorCal ProCase (INVITE ONLY)
Jun 5, 2022
Swift
10-yd
1.77
30-yd
4.13
60-yd
7.5
Run speed (max)
18.2
Run Speed (avg)
8
Jump Power (max)
1768
Jump Height (max)
23.9
Jump Height (avg)
18.3
Player News
- What We Saw: Week Five - Mar 20, 2023
- Power 25: Week Ahead - Mar 20, 2023
- 2023 RANKINGS UPDATE - Mar 1, 2023
- 2023 Team Previews: De La Salle Spartans - Feb 20, 2023
- Uncommitted Spotlight: Connor "Bear" Harrison - Jan 23, 2023
- NorCal Uncommitted Focus: Ranked 2023 grads - Oct 18, 2022
- BAWS Uncommitted: Quick Hits - Sep 30, 2022
- BAWS Uncommitted: Blast Leaderboard - Sep 22, 2022
- BAWS Uncommitted: TrackMan Hitting Data - Sep 21, 2022
- BAWS Uncommitted: Stats Leaderboard - Sep 19, 2022
- Northern California ProCase: TrackMan Hitting Leaderboard - Jun 20, 2022
- Northern California ProCase: Blast Motion Leaderboard - Jun 16, 2022
- Northern California ProCase: Stat Leaders - Jun 9, 2022
- SoCal Upperclass Games Scouting Reports: Catchers - Oct 5, 2021
- SoCal Upperclass Games: Blast Motion Leaderboard - Sep 23, 2021
- SoCal Upperclass Games: Stats Leaders - Sep 22, 2021
- Norcal Underclass - Catchers - Jun 15, 2020
- Northern CA Underclass Quick Hits - Jun 10, 2020
- Norcal Underclass Stats Leaders - Jun 9, 2020
UPCOMING EVENTS
| SHOWCASE | STATE | DATE | LOCATION |
| South Bay Preseason ID |
CA | 01/29 | Mission College - San Jose |
| East Bay Preseason ID | CA | 2/05 | Chabot College - Hayward |
| Rising Stars ID: Sacramento | CA | 3/12 | McBean Stadium - Lincoln |
| Rising Stars ID: Bay Area | CA | 4/23 | Chabot College - Hayward |
RELATED TOPICS
- CA Uncommitted Spotlight: '26 OF Will Suslow 8/29/24
- CA Class of 2025 Player Rankings Updated 8/28/24
- CA Uncommitted Spotlight: '26 OF Royce McKenzie 8/27/24
- CA Uncommitted Spotlight: '26 C Derrick Robertson 8/26/24
- CA Future Games Spotlight: RHP Dustin Dunwoody 8/22/24
- CA CA State Games: TrackMan Pitching Leaderboards 8/22/24
- CA Uncommitted Spotlight: '26 INF Greyson Gullage 8/21/24
- CA CA State Games: TrackMan Hitting Leaderboards 8/21/24
- CA Future Games Spotlight: OF Camden Goetz 8/21/24
- CA Uncommitted Spotlight: '26 OF Alex Mestman 8/20/24

