CLASS OF 2023
OF
OF
Bryce
Nevils
Western Kentucky
Brother Rice (HS) • IL
6' 0" • 188LBS
R/R • 20yr 2mo
Travel Team: White Sox Ace
Brother Rice (HS) • IL
6' 0" • 188LBS
R/R • 20yr 2mo
Travel Team: White Sox Ace
Rankings
2023 National
Rankings available to Premium Subscriber
2023 State
Rankings available to Premium Subscriber
Commitment
Best Of Stats
23.5
Hand Speed (max)
8/09/22
79.1
Bat Speed (max)
3/27/21
22.8
Rot. Acc (max)
3/27/21
90
Hard Hit %
8/09/22
97.8
Exit Velocity (max)
2/26/22
92.1
Exit Velocity (avg)
8/09/22
355
Distance (max)
2/26/22
80
Sweet Spot %
2/26/22
6.87
60
7/06/21
-
30-yd
-
10-yd
-
Run speed (max)
74
INF Velo
3/03/19
87
OF Velo
2/26/22
76
C Velo
3/27/21
1.95 - 2.12
Pop Time
1/29/22
Positional Tools
2022
2021
2020
2019
2018
60 Yard Dash
The athlete's fastest 60-yard dash time in the given event year. Measured in seconds (s)
6.89
Pop Time
The athlete's fastest pop time in the given event year. Measured from glove to glove, in seconds (s).
1.95 - 2.13
Catcher Velocity
The athlete's maximum throwing velocity from the catcher position in the given event year. Measured in miles per hour (MPH).
74.0
Outfield Velocity
The athlete's maximum throwing velocity from an outfield position in the given event year. Measured in miles per hour (MPH).
87.0
Power / Speed Score
A simple calculation that divides the athlete’s Exit Velocity Max by the athlete’s 60 Yard Dash time for the given event year. For example, 98 MPH / 7.00s = 14.00.
14.2
60 Yard Dash
The athlete's fastest 60-yard dash time in the given event year. Measured in seconds (s)
6.87
Pop Time
The athlete's fastest pop time in the given event year. Measured from glove to glove, in seconds (s).
2.00 - 2.19
Catcher Velocity
The athlete's maximum throwing velocity from the catcher position in the given event year. Measured in miles per hour (MPH).
76.0
Power / Speed Score
A simple calculation that divides the athlete’s Exit Velocity Max by the athlete’s 60 Yard Dash time for the given event year. For example, 98 MPH / 7.00s = 14.00.
13.6
60 Yard Dash
The athlete's fastest 60-yard dash time in the given event year. Measured in seconds (s)
7.38
Pop Time
The athlete's fastest pop time in the given event year. Measured from glove to glove, in seconds (s).
2.11 - 2.28
Catcher Velocity
The athlete's maximum throwing velocity from the catcher position in the given event year. Measured in miles per hour (MPH).
72.0
Power / Speed Score
A simple calculation that divides the athlete’s Exit Velocity Max by the athlete’s 60 Yard Dash time for the given event year. For example, 98 MPH / 7.00s = 14.00.
12.7
60 Yard Dash
The athlete's fastest 60-yard dash time in the given event year. Measured in seconds (s)
7.61
Pop Time
The athlete's fastest pop time in the given event year. Measured from glove to glove, in seconds (s).
2.18 - 2.44
Catcher Velocity
The athlete's maximum throwing velocity from the catcher position in the given event year. Measured in miles per hour (MPH).
69.0
Infield Velocity
The athlete's maximum throwing velocity from an infield position in the given event year. Measured in miles per hour (MPH).
74.0
Power / Speed Score
A simple calculation that divides the athlete’s Exit Velocity Max by the athlete’s 60 Yard Dash time for the given event year. For example, 98 MPH / 7.00s = 14.00.
10.9
60 Yard Dash
The athlete's fastest 60-yard dash time in the given event year. Measured in seconds (s)
8.38
Pop Time
The athlete's fastest pop time in the given event year. Measured from glove to glove, in seconds (s).
2.44 - 2.61
Catcher Velocity
The athlete's maximum throwing velocity from the catcher position in the given event year. Measured in miles per hour (MPH).
62.0
Infield Velocity
The athlete's maximum throwing velocity from an infield position in the given event year. Measured in miles per hour (MPH).
68.0
Power / Speed Score
A simple calculation that divides the athlete’s Exit Velocity Max by the athlete’s 60 Yard Dash time for the given event year. For example, 98 MPH / 7.00s = 14.00.
8.6
Hitting

2022
2021
2020
Exit Velocity Max
The highest exit velocity of any batted ball in the given event year. Measured in miles per hour (MPH).
97.8
Exit Velocity Avg
Average exit velocity of all batted balls in the given event year. Measured in miles per hour (MPH).
86.3
Distance Max
The highest flight distance of any batted ball in the given event year. Measured in feet (ft).
355
Distance Avg
Average flight distance of all batted balls in the given event year. Measured in feet (ft).
246
Launch Angle Avg
Average launch angle of all batted balls in the given event year. Measured in degrees.
22.6
Hard Hit %
Percentage of batted balls with exit velocities over 95 MPH in the given event year.
Sweet Spot %
Percentage of batted balls in the given event year with a launch angle between 8° and 32°.
Line Drive %
Percentage of batted balls with launch angles between 10 and 25 degrees in the given event year.
Fly Ball %
Percentage of batted balls with launch angles between 25 and 50 degrees in the given event year.
Ground Ball %
Percentage of batted balls with launch angles below 10 degrees in the given event year.
Exit Velocity Max
The highest exit velocity of any batted ball in the given event year. Measured in miles per hour (MPH).
93.7
Exit Velocity Avg
Average exit velocity of all batted balls in the given event year. Measured in miles per hour (MPH).
82.2
Distance Max
The highest flight distance of any batted ball in the given event year. Measured in feet (ft).
344
Distance Avg
Average flight distance of all batted balls in the given event year. Measured in feet (ft).
197
Launch Angle Avg
Average launch angle of all batted balls in the given event year. Measured in degrees.
20.2
Hard Hit %
Percentage of batted balls with exit velocities over 95 MPH in the given event year.
Sweet Spot %
Percentage of batted balls in the given event year with a launch angle between 8° and 32°.
Line Drive %
Percentage of batted balls with launch angles between 10 and 25 degrees in the given event year.
Fly Ball %
Percentage of batted balls with launch angles between 25 and 50 degrees in the given event year.
Ground Ball %
Percentage of batted balls with launch angles below 10 degrees in the given event year.
Exit Velocity Max
The highest exit velocity of any batted ball in the given event year. Measured in miles per hour (MPH).
93.6
Exit Velocity Avg
Average exit velocity of all batted balls in the given event year. Measured in miles per hour (MPH).
86.4
Distance Max
The highest flight distance of any batted ball in the given event year. Measured in feet (ft).
319
Distance Avg
Average flight distance of all batted balls in the given event year. Measured in feet (ft).
208
Launch Angle Avg
Average launch angle of all batted balls in the given event year. Measured in degrees.
18.7
Hard Hit %
Percentage of batted balls with exit velocities over 95 MPH in the given event year.
Sweet Spot %
Percentage of batted balls in the given event year with a launch angle between 8° and 32°.
Line Drive %
Percentage of batted balls with launch angles between 10 and 25 degrees in the given event year.
Fly Ball %
Percentage of batted balls with launch angles between 25 and 50 degrees in the given event year.
Ground Ball %
Percentage of batted balls with launch angles below 10 degrees in the given event year.
Illinois State Games (Invite-Only)
Aug 9, 2022
Trackman - Hitting
95.0
Exit Velocity (max)
92.1
Exit Velocity (avg)
251
Distance (avg)
354
Distance (max)
Hard Hit %
Sweet Spot %
Line Drive %
Fly Ball %
Ground Ball %
Preseason All-State: Upperclass (Invite-Only)
Feb 26, 2022
Trackman - Hitting
97.8
Exit Velocity (max)
90.8
Exit Velocity (avg)
258
Distance (avg)
355
Distance (max)
Hard Hit %
Sweet Spot %
Line Drive %
Fly Ball %
Ground Ball %
Preseason ProCase (Invite-Only)
Jan 29, 2022
Trackman - Hitting
92.5
Exit Velocity (max)
82.7
Exit Velocity (avg)
241
Distance (avg)
343
Distance (max)
Hard Hit %
Sweet Spot %
Line Drive %
Fly Ball %
Ground Ball %
PBR ProCase - Midwest (Invite Only)
Jul 6, 2021
Trackman - Hitting
93.7
Exit Velocity (max)
83.2
Exit Velocity (avg)
214
Distance (avg)
344
Distance (max)
Hard Hit %
Sweet Spot %
Line Drive %
Fly Ball %
Ground Ball %
Underclass Invitational (Invite Only)
Mar 27, 2021
Trackman - Hitting
92.4
Exit Velocity (max)
80.7
Exit Velocity (avg)
170
Distance (avg)
251
Distance (max)
Hard Hit %
Sweet Spot %
Line Drive %
Fly Ball %
Ground Ball %
Underclass Games (Invite Only)
Jul 21, 2020
Trackman - Hitting
93.6
Exit Velocity (max)
86.4
Exit Velocity (avg)
208
Distance (avg)
319
Distance (max)
Hard Hit %
Sweet Spot %
Line Drive %
Fly Ball %
Ground Ball %
Hitting

2022
2021
Hand Speed Max
The highest Peak Hand Speed of any swing in the given event year.
23.5
Hand Speed Avg
The average Peak Hand Speed for all swings in the given event year.
21.6
Bat Speed Max
The highest Bat Speed of any swing in the given event year.
78.1
Bat Speed Avg
The average Bat Speed for all swings in the given event year.
68.9
Rotational Acceleration Max
The highest Rotational Acceleration of any swing in the given event year.
Rotational Acceleration Avg
The average Rotational Acceleration for all swings in the given event year.
On-Plane Efficiency Max
The highest On-Plane Efficiency of any swing in the given event year.
On-Plane Efficiency Avg
The average On-Plane Efficiency for all swings in the given event year.
Hand Speed Max
The highest Peak Hand Speed of any swing in the given event year.
22.0
Hand Speed Avg
The average Peak Hand Speed for all swings in the given event year.
21.3
Bat Speed Max
The highest Bat Speed of any swing in the given event year.
79.1
Bat Speed Avg
The average Bat Speed for all swings in the given event year.
69.2
Rotational Acceleration Max
The highest Rotational Acceleration of any swing in the given event year.
Rotational Acceleration Avg
The average Rotational Acceleration for all swings in the given event year.
On-Plane Efficiency Max
The highest On-Plane Efficiency of any swing in the given event year.
On-Plane Efficiency Avg
The average On-Plane Efficiency for all swings in the given event year.
Illinois State Games (Invite-Only)
Aug 9, 2022
Blast - Hitting
23.5
Hand Speed (max)
22.2
Hand Speed (avg)
76.2
Bat Speed (max)
68.3
Bat Speed (avg)
Rot. Acc (max)
Rot. Acc (avg)
On Plane Eff (avg)
MaxOnPlaneEfficiency
Preseason All-State: Upperclass (Invite-Only)
Feb 26, 2022
Blast - Hitting
22.2
Hand Speed (max)
21.6
Hand Speed (avg)
70.7
Bat Speed (max)
68.5
Bat Speed (avg)
Rot. Acc (max)
Rot. Acc (avg)
On Plane Eff (avg)
MaxOnPlaneEfficiency
Preseason ProCase (Invite-Only)
Jan 29, 2022
Blast - Hitting
23.4
Hand Speed (max)
21.2
Hand Speed (avg)
78.1
Bat Speed (max)
69.4
Bat Speed (avg)
Rot. Acc (max)
Rot. Acc (avg)
On Plane Eff (avg)
MaxOnPlaneEfficiency
PBR ProCase - Midwest (Invite Only)
Jul 6, 2021
Blast - Hitting
21.6
Hand Speed (max)
21.2
Hand Speed (avg)
70.9
Bat Speed (max)
68.3
Bat Speed (avg)
Rot. Acc (max)
Rot. Acc (avg)
On Plane Eff (avg)
MaxOnPlaneEfficiency
Underclass Invitational (Invite Only)
Mar 27, 2021
Blast - Hitting
22.0
Hand Speed (max)
21.4
Hand Speed (avg)
79.1
Bat Speed (max)
69.7
Bat Speed (avg)
Rot. Acc (max)
Rot. Acc (avg)
On Plane Eff (avg)
MaxOnPlaneEfficiency
Underclass Games (Invite Only)
Jul 21, 2020
Blast - Hitting
25.1
Hand Speed (max)
23.5
Hand Speed (avg)
74.6
Bat Speed (max)
70.0
Bat Speed (avg)
Rot. Acc (max)
Rot. Acc (avg)
On Plane Eff (avg)
Pitching

Pitch Scores
Pitching Velos
Game Performance

Visual Edge

2022
2021
Edge Score
The highest Edge Score within the given year. Edge Score is a comprehensive score that takes the core-six visual skills into account, providing an assessment of an athlete’s overall visual ability.
79.69
Edge Score
The highest Edge Score within the given year. Edge Score is a comprehensive score that takes the core-six visual skills into account, providing an assessment of an athlete’s overall visual ability.
71.38
Pitch Ai

Notes
News
- Preseason Power 25 Countdown: No. 4 Brother Rice - Mar 11, 2024
- IHSA Playoff Scout Blog - Jun 26, 2023
- Edwardsville Takes Down Brother Rice To Repeat As 4A State Champions - Jun 11, 2023
- 4A IHSA State Playoffs Preview - Jun 8, 2023
- Week 4 Diamond Notes - Apr 14, 2023
- Preseason Power 25 Countdown: No. 6 Brother Rice - Mar 13, 2023
- Q&A With Western Kentucky Commit Bryce Nevils - Jan 5, 2023
- Illinois State Games: 2023 Position Player Analysis - Oct 31, 2022
- Illinois Class of 2023 Rankings Updated - Sep 7, 2022
- Illinois State Games: Takeaways - Aug 15, 2022
- Illinois State Games: Roster Preview - Aug 4, 2022
- Preseason All-State Upperclass: Catcher Analysis - Jul 7, 2022
- Preseason All-State Upperclass: Outfield Analysis - Jul 7, 2022
- Final Illinois Power 25 Team Rankings - Jun 15, 2022
- IHSA 4A State Playoffs: Preview Story - Jun 9, 2022
- Week 8 Games - May 19, 2022
- Class of 2023 Rankings: Uncommitted Position Players - Apr 28, 2022
- Preseason Power 25 Countdown: No. 2 Brother Rice - Mar 14, 2022
- Preseason All-State: Upperclass TrackMan Files - Mar 7, 2022
- Preseason All-State: Upperclass Statistical Analysis - Mar 4, 2022
- IL Preseason All-State - Upperclass: Preview - Feb 23, 2022
- IL/WI Preseason ProCase: Quick Hits - Jan 31, 2022
- Best of 2021: 60-Yard Dash Leaders - Jan 5, 2022
- Underclass Invitational: Top Overall 2023 Prospects - Jun 12, 2021
- Underclass Invitational: Catcher Analysis - Jun 1, 2021
- Week 4 Games - May 17, 2021
- IL/WI Underclass Games: Catcher Analysis - Oct 19, 2020
- IL/WI Underclass Games: Takeaways - Jul 22, 2020
- Illinois Underclass Invitational: Top Overall 2023 Prospects - Apr 10, 2020
- Underclass Invitational: Catcher Analysis - Apr 3, 2020
- Prospects To Know: Underclass World Series - Oct 17, 2019
- Future Prospects Showcase & Educational Camp - McCook: Player Analysis - May 28, 2019
- Future Prospects Showcase McCook: Statistical Analysis - Mar 5, 2019
- Junior Future Games Scout Blog: Teams Illinois and Wisconsin - Aug 14, 2018
- Future Prospects And Educational Camp: March 25th Analysis - Apr 27, 2018
Comments
Draft Reports
Contact
Premium Content Area
To unlock contact information, you need to purchase a ScoutPLUS subscription.
Purchase Subscription OR
Login






 Sign in to view rankings
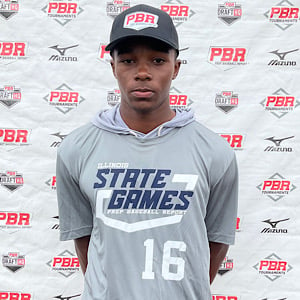
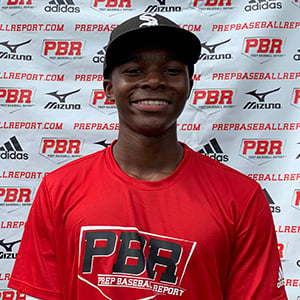
Western Kentucky commit, currently ranked No. 25 in the Illinois’ 2023 class. 6-foot, 188-pound, right-handed hitter outfielder with advanced strength in his lower half. Led off and played right field. Confident presence in the box and took a number of quality swings on the day. Jumped on the first pitch he saw in his second at-bat and launched a no-doubt two-run home run over the left-field fence. Creates advanced bat speed with present pull-side power at the plate. Tough out who has a knack for the barrel and continues to improve defensively in every look.
Western Kentucky commit. Nevils helped lead Brother Rice to a 4-0 week in conference play after going 6-for-12 (.500 BA) with four doubles, six RBIs, five runs, three stolen bases, and five walks. Against St. Ignatius, Nevils went 2-for-3 with a double, three doubles, three runs, three RBIs, and two walks. In their 6-3 win over De La Salle, he went 2-for-4 with two doubles, an RBI, and a run scored.
C/OF Bryce Nevils (Brother Rice, 2023) was another major winner from this event, committing to Western Kentucky a few days afterwards. At a strong, athletic 6-foot-1, 188-pounds, Nevils ran a 6.89 60-yard dash, reached a peak exit velocity of 97.8 mph, and topped at 87 mph from the outfield during Tuesday’s workout. That strength and athleticism translated seamlessly in-game for Nevils, who launched a no-doubt home run and short hopped the left field fence on day two. He also flew around the basepaths, taking extra-bases at will and serving as an offensive manufacturer for his squad throughout the event. Over the course of the two days, no one stood out on the bases more than Nevils. He is ultra-aggressive, runs better than his frame would indicate, showed tremendous feel gaining ground on his leadoffs, especially at second base and utilized a delayed steal numerous times without much recourse. Nevils all-around baseball abilities, to go along with his in-game at-bats, set him apart from most of his peers.
Positional Profile: PF
Body: 6-0, 185-pounds. Strong, athletic overall build, advanced strength in lower half.
Hits: RHH. Squared, balanced setup, deep load and leg-lift trigger. Creates easy, controlled bat speed. Was consistently on the barrel and works with authority to both gaps. Was one of the most impactful in-game performers of the event; finished 3-for-7, HR, 2B, 3 SB, BB, 2 RBI, 3 R.
Power: 95 max exit velocity, averaged 92.1 MPH. 354' max distance.
Arm: RH. OF-87 mph. Short quick arm action generates throws with life and carry from a high 3/4 slot.
Defense: Bouncy, athletic, multi-positional prospect. Clean outfield actions, plays light on his feet and in rhythm, soft hands and smooth release.
Run: 6.89 runner in the 60.
Vizual Edge: 79.69 Edge Score
Continues to be one of the top uncommitted juniors in the state. Nevils had another two hit performance against Chicago Catholic League rival St. Rita. During the first at-bat, Nevils swung at the first pitch for a single past the third baseman. Nevils’ final at-bat came when the game was tied 4-4 in the sixth inning; gave Brother Rice a late lead with a two-run blast to the pull-side. Finished 2-for-3 with a home run and two RBIs.
Uncommitted junior, ranked No. 30 in the state. 6-foot-1, 188-pound, athletic frame with advanced strength in his lower half. At the plate right-handed hitting catcher, setups in a slightly crouched stance with high active hands. Uses a toe tap load/stride to help stay on his back leg and adjust to pitches. Quick, athletic hands, compact swing with feel for the barrel. Showed the ability to hit for both contact and power while showing plate discipline and pitch recognition. Nevils finished 2-for-3 with a two-run home run, hustle double, three RBIs, stolen base and a run scored.
Positional Profile: C/OF
Body: 6-1, 188-pounds.
Hit: RHH. Upright stance. Loose and relaxed. Long leg-kick trigger. Strong hands, flat through the zone, creates backspin. Flashed easy pull-side power.
Power: 97.8 max exit velocity, averaged 90.8 mph. 354’ max distance.
Arm: RH. C - 73 mph. OF - 87 mph. Short, clean arm circle, over-the-top slot, quick arm with carry through the target, accurate.
Defense: 2.07-2.13 pop times. OF: Athletic footwork, athletic body, confident hands, loose, athletic actions/ C: Clean exchange, quick feet, athletic actions.
Run: 6.98 runner in the 60.
Positional Profile: OF/C
Body: 6-1, 188-pounds.
Hit: RHH. Upright stance. Loose and relaxed. Long leg-kick trigger. Strong hands, flat through the zone, creates backspin. Flashed easy pull-side power.
Power: 97.8 max exit velocity, averaged 90.8 mph. 354’ max distance.
Arm: RH. C - 73 mph. OF - 87 mph. Short, clean arm circle, over-the-top slot, quick arm with carry through the target, accurate.
Defense: OF: Athletic footwork, athletic body, confident hands, loose, athletic actions/ C: Clean exchange, quick feet, athletic actions.
Run: 6.98 runner in the 60.
Uncommitted, 6-foot-1, 188-pound, athletic frame with advanced strength in his lower half. Worked out behind the plate and in the outfield. Possesses some of the softest, receptive hands from behind the plate, in the class. Highly-advanced receiver with clean, athletic actions and plays directional out of the crouch. Arm played over the top from the crouch and topped at 74 mph with a low pop time of 1.95. Caught our attention with his round of outfield defense. Active, quick feet, proper routes, got behind the baseball and looked natural despite being fairly new to the position. Played through the baseball athletically and showed off a quicker, stronger arm than he did behind the plate. From the outfield, his arm played quick and quick while his throws played with true four-seam carry, were consistently on the target and topped at 86 mph. At the plate, right-handed hitter has quick, strong hands and keeps the barrel flat and through the hitting zone a long time. Nevils was on the barrel with authority (65% sweet spot percentage) of his swings which was fourth-best of the event. Nevils averaged 82.7 mph off the bat and his furthest batted ball travelled 342 feet. One of the top uncommitted prospects in the Illinois’ 2023 class.
Positional Profile: C/OF
Body: 6-0, 188-pounds. Strong, athletic build with thick lower half.
Hit: RHH. Balanced setup, smooth load, leg kick, hands load, balanced throughout. Short swing, direct path, average bat speed of 69.7 MPH, gap-to-gap approach, line drives.
Power: 92.42 max exit velocity, averaged 80.69 mph. 250’ max distance.
Arm: RH. C - 76 mph. Short arm action, over-the-top arm slot.
Defense: 2.00-2.08 pop times. Advanced hands, fluid feet, clean exchanges, shows athleticism.
Run: 7.14 runner in the 60.
Positional Profile: C/3B
Body: 6-0, 176-pounds. Athletic frame with strength in lower half. Has added over 10 pounds of quality muscle since a February event.
Hit: RHH. Balanced setup, wide slightly crouched setup, smooth load and leg-kick timing trigger. Presence in the box, highly-repeatable swing. Compact swing, stays connected and on plane. Fast bat, level through the zone and extension through contact. Line-drive, middle of the field approach with fluid rhythm and balance throughout. One of the top BP rounds on the day.
Power: 89 mph exit velocity from the tee. Max exit velocity of 93.63 mph during BP, via TrackMan.
Arm: RH. C - 71 mph. Short, over-the-top arm action.
Defense: 2.11-2.28 pop times. Wide, squared setup, soft hands, clean and fluid footwork out of the crouch.
Run: 7.38 runner in the 60.
Positional Profile: C
Body: 6-foot, 169-pounds. Long-levered, high-waisted, athletic, projectable frame.
Hit: RHH. Square slightly-crouched setup, smooth load and leg-kick timing trigger. Repeatable swing, advanced approach, uses the entire field, stays within himself. Loose hands, easy bat speed, creates whip, consistent hard line drive contact and balanced finish.
Power: 92 mph exit velocity from the tee.
Arm: RH. C - 72 mph. Long draw out of the glove, plays true from an over-the-top slot.
Defense: 2.11-2.19 pop times. Light on his feet, clean and directional out of the chute, agile block. Soft hands, quiet receiver.
Run: 7.59 runner in the 60.
Even more than his gifted tools, Nevils’ ability to make adjustments throughout the weekend stood out. The young backstop has a proportionally, naturally strong frame that is likely to develop much more strength in the future. What started off the weekend as a load with some segmentation at the plate quickly morphed into a more fluid approach. When timed up, the hands worked back in sync with a leg kick, and there was noticeable bat speed through the zone on a flat path. The bat-to-ball skills are solid as he is aggressive while still being in control. Behind the plate, Nevils worked to block balls, and showcases advanced receiving abilities for his age. His quick footwork and transfer along with a strong throwing arm allowed him to cut down the running game, and impressed between innings. Overall, Nevils’ all around game is likely to bring many coaches/scouts to games over the next four years.
Positional Profile: C/3B
Body: 5-10, 147-pounds.
Defense: 2.25-2.44 pop times. Natural catchers actions, soft hands and fluid footwork with a clean exchange.
Arm: RH. C - 69 mph. INF - 74 mph. Short and over the top arm action, showed accuracy and carry.
Hit: RHH. Balanced and slightly crouched, short stride. Long and loose bat path, line drive and gap to gap approach.
Power: 73 mph exit velocity from the tee.
Run: 7.81 runner in the 60.
(Junior Future Games) - 5-foot-7, 135-pound, right-handed hitting catcher, athleticism in frame. Defensively, behind the plate, smooth actions, receives in rhythm, quick transfer, sticks pitches naturally. Arm is short and loose, accurate throws on the bag, topped 66 mph and popped 2.34-2.55 from the crouch. Offensively, loose hands, fundamentals are sound, level path with bat speed, exit velocity topped 76 mph from a tee.
5-foot-7, 135-pound, right-handed hitting two-way player, high-waisted frame. At the plate, balanced, open setup, back load, short stride, maintains balance. Utilizes lower half well, short, level bat path, line drive abilities, hits with smooth rhythm involved. Exit velocity topped 72 mph from a tee. Defensively showed athletic actions. Pop times ranged between 2.44-2.61. Agile blocker, fluid footwork, quick transfer and release, short, loose arm action, over the top slot. Throws topped 62 mph from the crouch. Similar actions from the infield, smooth, natural abilities. Throws topped 68 mph across the infield. 8.38 runner in the 60.