CLASS OF 2024
OF
RHP
Cal
Darling
Bradley-Bourbonnais (HS) • IL
 6' 2" • 194.9LBS
R/R • 18yr 6mo
Travel Team: Bourbonnais Braves
R/R • 18yr 6mo
Travel Team: Bourbonnais Braves
Rankings
2024 National
Rankings available to Premium Subscriber
2024 State
Rankings available to Premium Subscriber
Commitment
Best Of Stats
22.8
Hand Speed (max)
2/28/21
78.3
Bat Speed (max)
2/25/23
14.8
Rot. Acc (max)
2/28/21
-
Hard Hit %
101.1
Exit Velocity (max)
8/08/23
87.4
Exit Velocity (avg)
2/25/23
357
Distance (max)
2/25/23
60
Sweet Spot %
2/25/23
7.26
60
8/08/23
4.03
30-yd
8/08/23
1.73
10-yd
8/08/23
19
Run speed (max)
8/08/23
-
INF Velo
93
OF Velo
2/25/23
-
C Velo
-
Pop Time
Positional Tools
2023
2022
2021
60 Yard Dash
The athlete's fastest 60-yard dash time in the given event year. Measured in seconds (s)
7.26
Outfield Velocity
The athlete's maximum throwing velocity from an outfield position in the given event year. Measured in miles per hour (MPH).
93.0
Power / Speed Score
A simple calculation that divides the athlete’s Exit Velocity Max by the athlete’s 60 Yard Dash time for the given event year. For example, 98 MPH / 7.00s = 14.00.
13.9
60 Yard Dash
The athlete's fastest 60-yard dash time in the given event year. Measured in seconds (s)
7.31
Outfield Velocity
The athlete's maximum throwing velocity from an outfield position in the given event year. Measured in miles per hour (MPH).
88.0
Power / Speed Score
A simple calculation that divides the athlete’s Exit Velocity Max by the athlete’s 60 Yard Dash time for the given event year. For example, 98 MPH / 7.00s = 14.00.
13.4
60 Yard Dash
The athlete's fastest 60-yard dash time in the given event year. Measured in seconds (s)
7.64
Outfield Velocity
The athlete's maximum throwing velocity from an outfield position in the given event year. Measured in miles per hour (MPH).
82.0
Power / Speed Score
A simple calculation that divides the athlete’s Exit Velocity Max by the athlete’s 60 Yard Dash time for the given event year. For example, 98 MPH / 7.00s = 14.00.
11.6
Hitting

2023
2022
2021
Exit Velocity Max
The highest exit velocity of any batted ball in the given event year. Measured in miles per hour (MPH).
101.1
Exit Velocity Avg
Average exit velocity of all batted balls in the given event year. Measured in miles per hour (MPH).
86.6
Distance Max
The highest flight distance of any batted ball in the given event year. Measured in feet (ft).
357
Distance Avg
Average flight distance of all batted balls in the given event year. Measured in feet (ft).
226
Launch Angle Avg
Average launch angle of all batted balls in the given event year. Measured in degrees.
25.2
Hard Hit %
Percentage of batted balls with exit velocities over 95 MPH in the given event year.
Sweet Spot %
Percentage of batted balls in the given event year with a launch angle between 8° and 32°.
Line Drive %
Percentage of batted balls with launch angles between 10 and 25 degrees in the given event year.
Fly Ball %
Percentage of batted balls with launch angles between 25 and 50 degrees in the given event year.
Ground Ball %
Percentage of batted balls with launch angles below 10 degrees in the given event year.
Exit Velocity Max
The highest exit velocity of any batted ball in the given event year. Measured in miles per hour (MPH).
98.0
Exit Velocity Avg
Average exit velocity of all batted balls in the given event year. Measured in miles per hour (MPH).
87.2
Distance Max
The highest flight distance of any batted ball in the given event year. Measured in feet (ft).
346
Distance Avg
Average flight distance of all batted balls in the given event year. Measured in feet (ft).
180
Launch Angle Avg
Average launch angle of all batted balls in the given event year. Measured in degrees.
14.1
Hard Hit %
Percentage of batted balls with exit velocities over 95 MPH in the given event year.
Sweet Spot %
Percentage of batted balls in the given event year with a launch angle between 8° and 32°.
Line Drive %
Percentage of batted balls with launch angles between 10 and 25 degrees in the given event year.
Fly Ball %
Percentage of batted balls with launch angles between 25 and 50 degrees in the given event year.
Ground Ball %
Percentage of batted balls with launch angles below 10 degrees in the given event year.
Exit Velocity Max
The highest exit velocity of any batted ball in the given event year. Measured in miles per hour (MPH).
88.3
Exit Velocity Avg
Average exit velocity of all batted balls in the given event year. Measured in miles per hour (MPH).
72.8
Distance Max
The highest flight distance of any batted ball in the given event year. Measured in feet (ft).
252
Distance Avg
Average flight distance of all batted balls in the given event year. Measured in feet (ft).
139
Launch Angle Avg
Average launch angle of all batted balls in the given event year. Measured in degrees.
13.4
Hard Hit %
Percentage of batted balls with exit velocities over 95 MPH in the given event year.
Sweet Spot %
Percentage of batted balls in the given event year with a launch angle between 8° and 32°.
Line Drive %
Percentage of batted balls with launch angles between 10 and 25 degrees in the given event year.
Fly Ball %
Percentage of batted balls with launch angles between 25 and 50 degrees in the given event year.
Ground Ball %
Percentage of batted balls with launch angles below 10 degrees in the given event year.
Illinois State Games (Invite-Only)
Aug 8, 2023
Trackman - Hitting
101.1
Exit Velocity (max)
85.7
Exit Velocity (avg)
200
Distance (avg)
342
Distance (max)
Hard Hit %
Sweet Spot %
Line Drive %
Fly Ball %
Ground Ball %
Preseason All-State: Upperclass (Invite-Only)
Feb 25, 2023
Trackman - Hitting
97.0
Exit Velocity (max)
87.4
Exit Velocity (avg)
249
Distance (avg)
357
Distance (max)
Hard Hit %
Sweet Spot %
Line Drive %
Fly Ball %
Ground Ball %
Illinois State Games (Invite-Only)
Aug 9, 2022
Trackman - Hitting
98.0
Exit Velocity (max)
87.2
Exit Velocity (avg)
180
Distance (avg)
346
Distance (max)
Hard Hit %
Sweet Spot %
Line Drive %
Fly Ball %
Ground Ball %
Underclass Trials - North
Jun 8, 2021
Trackman - Hitting
88.3
Exit Velocity (max)
76.9
Exit Velocity (avg)
146
Distance (avg)
252
Distance (max)
Sweet Spot %
Line Drive %
Fly Ball %
Ground Ball %
Chicago Preseason I.D.
Feb 28, 2021
Trackman - Hitting
79.9
Exit Velocity (max)
67.9
Exit Velocity (avg)
131
Distance (avg)
228
Distance (max)
Sweet Spot %
Line Drive %
Fly Ball %
Ground Ball %
Hitting

2023
2022
2021
Hand Speed Max
The highest Peak Hand Speed of any swing in the given event year.
20.2
Hand Speed Avg
The average Peak Hand Speed for all swings in the given event year.
19.6
Bat Speed Max
The highest Bat Speed of any swing in the given event year.
78.3
Bat Speed Avg
The average Bat Speed for all swings in the given event year.
74.5
Rotational Acceleration Max
The highest Rotational Acceleration of any swing in the given event year.
Rotational Acceleration Avg
The average Rotational Acceleration for all swings in the given event year.
On-Plane Efficiency Max
The highest On-Plane Efficiency of any swing in the given event year.
On-Plane Efficiency Avg
The average On-Plane Efficiency for all swings in the given event year.
Hand Speed Max
The highest Peak Hand Speed of any swing in the given event year.
21.1
Hand Speed Avg
The average Peak Hand Speed for all swings in the given event year.
20.1
Bat Speed Max
The highest Bat Speed of any swing in the given event year.
76.0
Bat Speed Avg
The average Bat Speed for all swings in the given event year.
71.6
Rotational Acceleration Max
The highest Rotational Acceleration of any swing in the given event year.
Rotational Acceleration Avg
The average Rotational Acceleration for all swings in the given event year.
On-Plane Efficiency Max
The highest On-Plane Efficiency of any swing in the given event year.
On-Plane Efficiency Avg
The average On-Plane Efficiency for all swings in the given event year.
Hand Speed Max
The highest Peak Hand Speed of any swing in the given event year.
22.8
Hand Speed Avg
The average Peak Hand Speed for all swings in the given event year.
20.8
Bat Speed Max
The highest Bat Speed of any swing in the given event year.
69.7
Bat Speed Avg
The average Bat Speed for all swings in the given event year.
64.8
Rotational Acceleration Max
The highest Rotational Acceleration of any swing in the given event year.
Rotational Acceleration Avg
The average Rotational Acceleration for all swings in the given event year.
On-Plane Efficiency Max
The highest On-Plane Efficiency of any swing in the given event year.
On-Plane Efficiency Avg
The average On-Plane Efficiency for all swings in the given event year.
Preseason All-State: Upperclass (Invite-Only)
Feb 25, 2023
Blast - Hitting
20.2
Hand Speed (max)
19.6
Hand Speed (avg)
78.3
Bat Speed (max)
74.5
Bat Speed (avg)
Rot. Acc (max)
Rot. Acc (avg)
On Plane Eff (avg)
MaxOnPlaneEfficiency
Illinois State Games (Invite-Only)
Aug 9, 2022
Blast - Hitting
21.1
Hand Speed (max)
20.1
Hand Speed (avg)
76.0
Bat Speed (max)
71.6
Bat Speed (avg)
Rot. Acc (max)
Rot. Acc (avg)
On Plane Eff (avg)
MaxOnPlaneEfficiency
Underclass Trials - North
Jun 8, 2021
Blast - Hitting
21.0
Hand Speed (max)
20.3
Hand Speed (avg)
69.7
Bat Speed (max)
67.3
Bat Speed (avg)
Rot. Acc (max)
Rot. Acc (avg)
On Plane Eff (avg)
MaxOnPlaneEfficiency
Chicago Preseason I.D.
Feb 28, 2021
Blast - Hitting
22.8
Hand Speed (max)
21.3
Hand Speed (avg)
66.4
Bat Speed (max)
62.3
Bat Speed (avg)
Rot. Acc (max)
Rot. Acc (avg)
On Plane Eff (avg)
MaxOnPlaneEfficiency
Pitching

Pitch Scores
Pitching Velos
Game Performance

2023
10 Yard Dash
The athlete's fastest 0-10-yard split time in the given event year. Measured in seconds.
1.73
30 Yard Dash
The athlete's fastest 0-30-yard split time in the given event year. Measured in seconds.
4.03
60 Yard Dash
The athlete's fastest 0-60-yard time in the given event year. Measured in seconds.
7.26
Top Speed (MPH)
The athlete's fastest split time converted to miles per hour.
RSi
The reactive strength index measurement of an athlete's explosiveness by comparing their jump height to the ground contact time in between their jumps. On a scale of 0-5.
Vertical Jump
A measure of any athlete's body strength and reach calculated from the flight time divided by the contact time.
Preseason All-State: Upperclass (Invite-Only)
Feb 25, 2023
Swift
1.79
10-yd
4.09
30-yd
7.33
60-yd
19.0
Run speed (max)
2.53
RSi (max)
2.53
RSi (avg)
1,811
Jump Power (max)
29.8
Jump Height (max)
29.0
Jump Height (avg)
Illinois State Games (Invite-Only)
Aug 9, 2022
Swift
1.77
10-yd
4.05
30-yd
7.31
60-yd
18.8
Run speed (max)
8.2
Run Speed (avg)
2.22
RSi (max)
2.22
RSi (avg)
1,690
Jump Power (max)
27.4
Jump Height (max)
27.2
Jump Height (avg)
Visual Edge

2023
2022
2021
Edge Score
The highest Edge Score within the given year. Edge Score is a comprehensive score that takes the core-six visual skills into account, providing an assessment of an athlete’s overall visual ability.
75.55
Edge Score
The highest Edge Score within the given year. Edge Score is a comprehensive score that takes the core-six visual skills into account, providing an assessment of an athlete’s overall visual ability.
77.08
Edge Score
The highest Edge Score within the given year. Edge Score is a comprehensive score that takes the core-six visual skills into account, providing an assessment of an athlete’s overall visual ability.
67.47
Pitch Ai

Notes
News
- Preseason Power 25 Countdown: No. 22 Bradley-Bourbonnais - Mar 5, 2024
- Illinois State Games: 2024 Outfielder Analysis - Oct 17, 2023
- Illinois State Games Takeaways: 2024s - Aug 16, 2023
- Preseason All State Upperclass: Outfield Analysis - May 9, 2023
- Preseason All State, Upperclass: Quick Hits - Mar 2, 2023
- Illinois State Games: Takeaways - Aug 15, 2022
- Chicago Preseason I.D.: Outfield Analysis - Apr 19, 2021
Comments
Draft Reports
Contact
Premium Content Area
To unlock contact information, you need to purchase a ScoutPLUS subscription.
Purchase Subscription OR
Login
Physical
2024
2023
Grip Strgth (LH)
Grip strength is a measure of a players bat control and ability to transfer power and speed during impact, measured in pounds of force generated; collected with elbow bent at 90 degrees.
Grip Strgth (RH)
Grip strength is a measure of a players bat control and ability to transfer power and speed during impact, measured in pounds of force generated; collected with elbow bent at 90 degrees.


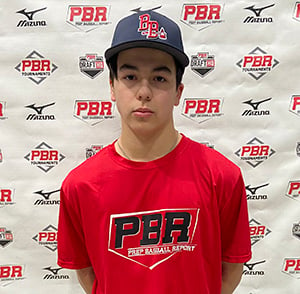





 Sign in to view rankings
Positional Profile: OF/RHP
Body: 6-2, 195-pounds.
Hit: RHH. Sits backside, knee knock trigger, gains ground. On time and in rhythm, on the barrel consistently, easy pull-side pop. mph bat speed with G’s of rotational acceleration.
Power: 101 max exit velocity, averaged 85.7 mph. 342’ max distance.
Arm: RH. OF - 91 mph. Throws on a line, acceleration out front, quick, clean, accurate, 3/4 slot.
Defense: Active feet, sure-handed, quick transfer.
Run: 7.26 runner in the 60.
OF Cal Darling (Bradley-Bourbonnais, 2024) had a loud showing in multiple areas of Tuesday’s workout. The recent Heartland CC commit recorded one of the hardest hit balls of the entire event (101.1 mph), sent his furthest batted ball 342 feet, and was up to 91 mph from the outfield, which tied for the second-hardest throw of the event.
Verbally committed to Heartland CC.
OF Cal Darling (Bradley-Bourbonnais) is another right-handed hitter who continues to warrant attention moving forward. Listed at 6-foot-1, 190-pounds, Darling has quick-twitch, strong hands at the plate while staying direct to the ball and physical through impact. He was consistently on time with a heavy barrel and registered a 97 mph exit velocity with a max batted ball of 356’. Darling also played fast in the outfield, attacking the baseball and gained ground through transfer while showing off a strong arm that topped at 93 mph from the outfield.
Positional Profile: OF
Body: 6-1, 190-pounds. Strong, defined build.
Hit: RHH. Balanced base, hands set high. Simple, repeatable swings; direct bat path, syncs up contact well, barrel feel.
Power: 97 max exit velocity, averaged 87.4 mph. 357’ max distance.
Arm: RH. OF - 93 mph. Life out of the hand with carry, 3/4 slot.
Defense: Steady actions, plays through the ball with intent.
Run: 7.33 runner in the 60.
OF Cal Darling (Bradley-Bourbonnais) is another right-handed hitter who continues to warrant attention moving forward. Listed at 6-foot-1, 190-pounds, Darling has quick-twitch, strong hands at the plate while staying direct to the ball and physical through impact. He was consistently on time with a heavy barrel and registered a 97 mph exit velocity with a max batted ball of 356’. Darling also played fast in the outfield, attacking the baseball and gained ground through transfer while showing off a strong arm that topped at 93 mph from the outfield.
Cal Darling (Bradley-Bourbonnais) is another uncommitted outfielder in the 2024 class who showed well for Team 7 throughout the week. Darling is a 6-foot-1, 185-pound, broad-shouldered, right-handed hitter with strong hands, direct path and the ability to elevate the baseball to the pull-side with backspin. During the workout, Darling’s hardest ball left his bat at 98 mph with a max distance of 320 feet. Darling collected three hits over the course of the two days with two doubles. Potent right-handed hitter to follow in the class.
Positional Profile: OF
Body: 6-1, 185-pounds. Wide-shouldered frame, strong wrists.
Hits: RHH. Balanced setup, short stride and finishes on balance. Creates easy hand and bat speed. Ball jumps off the barrel and stays flat through the zone.
Power: 98 max exit velocity, averaged 87.1 MPH. 320' max distance.
Arm: RH. OF-88 mph. Strong arm, short arm action, high 3/4 slot.
Defense: Deliberate routes, attacks the baseball, sure-hands and directional release.
Run: 7.31 runner in the 60.
Vizual Edge: 77.08 Edge Score
Positional Profile: SS/RHP
Body: 6-0, 170-pounds. Athletic frame, evenly distributed strength throughout.
Hit: RHH. Balanced/athletic setup, smooth load, leg-kick into a long stride. Direct to the ball, short/level path, fluid rhythm with a line-drive approach.
Power: 88.31 max exit velocity, averaged 76.85 mph. 252’ max distance.
Arm: RH. OF - 82 mph. 3/4 slot.
Defense: Fluid footwork with a clean exchange.
Run: 7.64 runner in the 60.
Positional Profile: OF/1B
Body: 6-0, 155-pounds.
Hit: R/R. Balanced setup, toe tap, short stride. Short swing, level bat path, pull-side tendencies.
Power: 79.92 max exit velocity, averaged 67.92 mph. 227’ max distance.
Arm: R/R. OF - 75 mph. Long arm action, high 3/4 arm slot.
Defense: Fields from the center of body, uses two hands.
Run: 7.95 runner in the 60.