CLASS OF 2023
SS
3B
Cal
Sefcik
Cincinnati
Marist (HS) • IL
6' 0" • 205LBS
R/R • 20yr 1mo
Travel Team: Cangelosi Sparks
Marist (HS) • IL
6' 0" • 205LBS
R/R • 20yr 1mo
Travel Team: Cangelosi Sparks
Rankings
2023 National
Rankings available to Premium Subscriber
2023 State
Rankings available to Premium Subscriber
Commitment
Best Of Stats
27.1
Hand Speed (max)
7/28/21
79.5
Bat Speed (max)
2/05/23
28.8
Rot. Acc (max)
2/05/23
100
Hard Hit %
2/05/23
108.2
Exit Velocity (max)
2/01/23
101.9
Exit Velocity (avg)
2/05/23
406
Distance (max)
2/01/23
91
Sweet Spot %
7/28/21
6.9
60
2/05/23
-
30-yd
-
10-yd
-
Run speed (max)
92
INF Velo
2/01/23
-
OF Velo
-
C Velo
-
Pop Time
Fastball
90.4
Velocity (max)
2/01/23
88.5 - 90.1
Velo Range
2/01/23
2081
Spin Rate (avg)
2/01/23
Changeup
80 - 82
Velo Range
2/01/23
1818
Spin Rate (avg)
2/01/23
Curveball
74 - 76
Velo Range
2/01/23
2043
Spin Rate (avg)
2/01/23
Positional Tools
2023
2021
2020
2019
2018
60 Yard Dash
The athlete's fastest 60-yard dash time in the given event year. Measured in seconds (s)
6.90
Infield Velocity
The athlete's maximum throwing velocity from an infield position in the given event year. Measured in miles per hour (MPH).
92.0
Power / Speed Score
A simple calculation that divides the athlete’s Exit Velocity Max by the athlete’s 60 Yard Dash time for the given event year. For example, 98 MPH / 7.00s = 14.00.
15.7
60 Yard Dash
The athlete's fastest 60-yard dash time in the given event year. Measured in seconds (s)
6.90
Infield Velocity
The athlete's maximum throwing velocity from an infield position in the given event year. Measured in miles per hour (MPH).
90.0
Power / Speed Score
A simple calculation that divides the athlete’s Exit Velocity Max by the athlete’s 60 Yard Dash time for the given event year. For example, 98 MPH / 7.00s = 14.00.
14.4
60 Yard Dash
The athlete's fastest 60-yard dash time in the given event year. Measured in seconds (s)
7.05
Infield Velocity
The athlete's maximum throwing velocity from an infield position in the given event year. Measured in miles per hour (MPH).
87.0
Power / Speed Score
A simple calculation that divides the athlete’s Exit Velocity Max by the athlete’s 60 Yard Dash time for the given event year. For example, 98 MPH / 7.00s = 14.00.
13.7
60 Yard Dash
The athlete's fastest 60-yard dash time in the given event year. Measured in seconds (s)
7.48
Infield Velocity
The athlete's maximum throwing velocity from an infield position in the given event year. Measured in miles per hour (MPH).
76.0
Power / Speed Score
A simple calculation that divides the athlete’s Exit Velocity Max by the athlete’s 60 Yard Dash time for the given event year. For example, 98 MPH / 7.00s = 14.00.
11.0
60 Yard Dash
The athlete's fastest 60-yard dash time in the given event year. Measured in seconds (s)
8.35
Infield Velocity
The athlete's maximum throwing velocity from an infield position in the given event year. Measured in miles per hour (MPH).
56.0
Power / Speed Score
A simple calculation that divides the athlete’s Exit Velocity Max by the athlete’s 60 Yard Dash time for the given event year. For example, 98 MPH / 7.00s = 14.00.
8.4
Hitting

2023
2021
2020
Exit Velocity Max
The highest exit velocity of any batted ball in the given event year. Measured in miles per hour (MPH).
108.2
Exit Velocity Avg
Average exit velocity of all batted balls in the given event year. Measured in miles per hour (MPH).
100.0
Distance Max
The highest flight distance of any batted ball in the given event year. Measured in feet (ft).
406
Distance Avg
Average flight distance of all batted balls in the given event year. Measured in feet (ft).
296
Launch Angle Avg
Average launch angle of all batted balls in the given event year. Measured in degrees.
17.3
Hard Hit %
Percentage of batted balls with exit velocities over 95 MPH in the given event year.
Sweet Spot %
Percentage of batted balls in the given event year with a launch angle between 8° and 32°.
Line Drive %
Percentage of batted balls with launch angles between 10 and 25 degrees in the given event year.
Fly Ball %
Percentage of batted balls with launch angles between 25 and 50 degrees in the given event year.
Ground Ball %
Percentage of batted balls with launch angles below 10 degrees in the given event year.
Exit Velocity Max
The highest exit velocity of any batted ball in the given event year. Measured in miles per hour (MPH).
99.6
Exit Velocity Avg
Average exit velocity of all batted balls in the given event year. Measured in miles per hour (MPH).
84.7
Distance Max
The highest flight distance of any batted ball in the given event year. Measured in feet (ft).
364
Distance Avg
Average flight distance of all batted balls in the given event year. Measured in feet (ft).
272
Launch Angle Avg
Average launch angle of all batted balls in the given event year. Measured in degrees.
34.8
Hard Hit %
Percentage of batted balls with exit velocities over 95 MPH in the given event year.
Sweet Spot %
Percentage of batted balls in the given event year with a launch angle between 8° and 32°.
Line Drive %
Percentage of batted balls with launch angles between 10 and 25 degrees in the given event year.
Fly Ball %
Percentage of batted balls with launch angles between 25 and 50 degrees in the given event year.
Ground Ball %
Percentage of batted balls with launch angles below 10 degrees in the given event year.
Exit Velocity Max
The highest exit velocity of any batted ball in the given event year. Measured in miles per hour (MPH).
96.4
Exit Velocity Avg
Average exit velocity of all batted balls in the given event year. Measured in miles per hour (MPH).
90.1
Distance Max
The highest flight distance of any batted ball in the given event year. Measured in feet (ft).
352
Distance Avg
Average flight distance of all batted balls in the given event year. Measured in feet (ft).
315
Launch Angle Avg
Average launch angle of all batted balls in the given event year. Measured in degrees.
24.8
Hard Hit %
Percentage of batted balls with exit velocities over 95 MPH in the given event year.
Sweet Spot %
Percentage of batted balls in the given event year with a launch angle between 8° and 32°.
Line Drive %
Percentage of batted balls with launch angles between 10 and 25 degrees in the given event year.
Fly Ball %
Percentage of batted balls with launch angles between 25 and 50 degrees in the given event year.
Ground Ball %
Percentage of batted balls with launch angles below 10 degrees in the given event year.
Super 60 Pro Showcase
Feb 5, 2023
Trackman - Hitting
107.1
Exit Velocity (max)
101.9
Exit Velocity (avg)
276
Distance (avg)
391
Distance (max)
Hard Hit %
Barrel %
Sweet Spot %
Line Drive %
Fly Ball %
Ground Ball %
Preseason ProCase (Invite-Only)
Feb 1, 2023
Trackman - Hitting
108.2
Exit Velocity (max)
98.5
Exit Velocity (avg)
315
Distance (avg)
406
Distance (max)
Hard Hit %
Barrel %
Sweet Spot %
Line Drive %
Fly Ball %
Ground Ball %
IL/IN/IA/WI Workout Pod
Jul 28, 2021
Trackman - Hitting
100.7
Exit Velocity (max)
96.2
Exit Velocity (avg)
256
Distance (avg)
375
Distance (max)
Hard Hit %
Sweet Spot %
Line Drive %
Fly Ball %
Ground Ball %
2021 Future Games
Jul 28, 2021
Trackman - Hitting
100.7
Exit Velocity (max)
96.2
Exit Velocity (avg)
256
Distance (avg)
375
Distance (max)
Hard Hit %
Sweet Spot %
Line Drive %
Fly Ball %
Ground Ball %
Underclass Invitational (Invite Only)
Mar 27, 2021
Trackman - Hitting
99.6
Exit Velocity (max)
84.7
Exit Velocity (avg)
272
Distance (avg)
364
Distance (max)
Hard Hit %
Sweet Spot %
Line Drive %
Fly Ball %
Underclass Showcase
Oct 25, 2020
Trackman - Hitting
96.4
Exit Velocity (max)
90.1
Exit Velocity (avg)
315
Distance (avg)
352
Distance (max)
Hard Hit %
Sweet Spot %
Line Drive %
Fly Ball %
Hitting

2023
2021
2020
Hand Speed Max
The highest Peak Hand Speed of any swing in the given event year.
26.0
Hand Speed Avg
The average Peak Hand Speed for all swings in the given event year.
24.8
Bat Speed Max
The highest Bat Speed of any swing in the given event year.
79.5
Bat Speed Avg
The average Bat Speed for all swings in the given event year.
74.9
Rotational Acceleration Max
The highest Rotational Acceleration of any swing in the given event year.
Rotational Acceleration Avg
The average Rotational Acceleration for all swings in the given event year.
On-Plane Efficiency Max
The highest On-Plane Efficiency of any swing in the given event year.
On-Plane Efficiency Avg
The average On-Plane Efficiency for all swings in the given event year.
Hand Speed Max
The highest Peak Hand Speed of any swing in the given event year.
27.1
Hand Speed Avg
The average Peak Hand Speed for all swings in the given event year.
26.1
Bat Speed Max
The highest Bat Speed of any swing in the given event year.
79.1
Bat Speed Avg
The average Bat Speed for all swings in the given event year.
73.8
Rotational Acceleration Max
The highest Rotational Acceleration of any swing in the given event year.
Rotational Acceleration Avg
The average Rotational Acceleration for all swings in the given event year.
On-Plane Efficiency Max
The highest On-Plane Efficiency of any swing in the given event year.
On-Plane Efficiency Avg
The average On-Plane Efficiency for all swings in the given event year.
Hand Speed Max
The highest Peak Hand Speed of any swing in the given event year.
26.0
Hand Speed Avg
The average Peak Hand Speed for all swings in the given event year.
24.9
Bat Speed Max
The highest Bat Speed of any swing in the given event year.
75.5
Bat Speed Avg
The average Bat Speed for all swings in the given event year.
73.6
Rotational Acceleration Max
The highest Rotational Acceleration of any swing in the given event year.
Rotational Acceleration Avg
The average Rotational Acceleration for all swings in the given event year.
On-Plane Efficiency Max
The highest On-Plane Efficiency of any swing in the given event year.
On-Plane Efficiency Avg
The average On-Plane Efficiency for all swings in the given event year.
Super 60 Pro Showcase
Feb 5, 2023
Blast - Hitting
26.0
Hand Speed (max)
24.8
Hand Speed (avg)
79.5
Bat Speed (max)
74.9
Bat Speed (avg)
Rot. Acc (max)
Rot. Acc (avg)
On Plane Eff (avg)
MaxOnPlaneEfficiency
Preseason ProCase (Invite-Only)
Feb 1, 2023
Blast - Hitting
25.8
Hand Speed (max)
24.8
Hand Speed (avg)
77.0
Bat Speed (max)
74.9
Bat Speed (avg)
Rot. Acc (max)
Rot. Acc (avg)
On Plane Eff (avg)
MaxOnPlaneEfficiency
2021 Future Games
Jul 28, 2021
Blast - Hitting
27.1
Hand Speed (max)
26.6
Hand Speed (avg)
79.1
Bat Speed (max)
74.8
Bat Speed (avg)
Rot. Acc (max)
Rot. Acc (avg)
On Plane Eff (avg)
MaxOnPlaneEfficiency
IL/IN/IA/WI Workout Pod
Jul 28, 2021
Blast - Hitting
27.1
Hand Speed (max)
26.6
Hand Speed (avg)
79.1
Bat Speed (max)
74.8
Bat Speed (avg)
Rot. Acc (max)
Rot. Acc (avg)
On Plane Eff (avg)
Underclass Invitational (Invite Only)
Mar 27, 2021
Blast - Hitting
26.9
Hand Speed (max)
25.8
Hand Speed (avg)
76.9
Bat Speed (max)
73.0
Bat Speed (avg)
Rot. Acc (max)
Rot. Acc (avg)
On Plane Eff (avg)
MaxOnPlaneEfficiency
Underclass Showcase
Oct 25, 2020
Blast - Hitting
26.0
Hand Speed (max)
24.9
Hand Speed (avg)
75.5
Bat Speed (max)
73.6
Bat Speed (avg)
Rot. Acc (max)
Rot. Acc (avg)
On Plane Eff (avg)
MaxOnPlaneEfficiency
Pitching

2023
Fastball
Velocity Max
The maximum observed fastball velocity in the given event year. Measured in miles per hour (MPH).
90.4
Fastball
Velocity Avg
The average velocity for all pitches of this type in the given event year. Measured in miles per hour (MPH).
89.3
Fastball
Spin Rate Avg
The average rate of spin for all pitches of this type in the given event year. Measured in rotations per minute (RPM).
2081
Fastball
Spin Score Avg
The average Bauer Units value of all fastballs in the given event year. Bauer Units are calculated for each pitch by dividing Spin Rate by Velocity.
23.3
Fastball
Total Movement Avg
The average total non-gravity movement for all pitches of this type in the given event year. Measured in inches (in).
Curveball
Velocity Avg
The average velocity for all pitches of this type in the given event year. Measured in miles per hour (MPH).
74.9
Curveball
Spin Rate Avg
The average rate of spin for all pitches of this type in the given event year. Measured in rotations per minute (RPM).
2043
Curveball
Total Movement Avg
The average total non-gravity movement for all pitches of this type in the given event year. Measured in inches (in).
Changeup
Velocity Avg
The average velocity for all pitches of this type in the given event year. Measured in miles per hour (MPH).
80.9
Changeup
Spin Rate Avg
The average rate of spin for all pitches of this type in the given event year. Measured in rotations per minute (RPM).
1818
Changeup
Total Movement Avg
The average total non-gravity movement for all pitches of this type in the given event year. Measured in inches (in).
Preseason ProCase (Invite-Only)
Feb 1, 2023
Trackman - Fastball
90.4
Velocity (max)
88.5 - 90.1
Velo Range
87.9
Eff Velocity (avg)
2,212
Spin Rate (max)
2,081
Spin Rate (avg)
IVB (max)
IVB (avg)
HM (max)
HM (avg)
Extension (avg)
Release Ht (avg)
Spin Score (max)
Zone %
Spin Efficiency % (avg)
Trackman - Curveball
76.3
Velocity (max)
74.0 - 75.9
Velo Range
73.5
Eff Velocity (avg)
2,120
Spin Rate (max)
2,043
Spin Rate (avg)
IVB (max)
IVB (avg)
HM (max)
HM (avg)
Extension (avg)
Release Ht (avg)
Spin Score (max)
Zone %
Spin Efficiency % (avg)
Trackman - ChangeUp
82.4
Velocity (max)
79.7 - 82.0
Velo Range
79.4
Eff Velocity (avg)
1,995
Spin Rate (max)
1,818
Spin Rate (avg)
IVB (max)
IVB (avg)
HM (max)
HM (avg)
Extension (avg)
Release Ht (avg)
Spin Score (max)
Zone %
Spin Efficiency % (avg)
Pitch Scores
Pitching Velos
2023
Fastball
Velocity Max
The maximum observed fastball velocity in the given event year. Measured in miles per hour (MPH).
90.0
Fastball
Velocity Avg
The average velocity for all pitches of this type in the given event year. Measured in miles per hour (MPH)
89.5
Curveball
Velocity Avg
The average velocity for all pitches of this type in the given event year. Measured in miles per hour (MPH)
75.0
Changeup
Velocity Avg
The average velocity for all pitches of this type in the given event year. Measured in miles per hour (MPH)
81.0
Game Performance

Visual Edge

2023
2021
Edge Score
The highest Edge Score within the given year. Edge Score is a comprehensive score that takes the core-six visual skills into account, providing an assessment of an athlete’s overall visual ability.
80.25
Edge Score
The highest Edge Score within the given year. Edge Score is a comprehensive score that takes the core-six visual skills into account, providing an assessment of an athlete’s overall visual ability.
69.61
Pitch Ai

Notes
News
- Preseason ProCase: Preview - Jan 26, 2024
- Top-10 Stories of 2023: No. 8 Illinois Winners At The Super 60 - Dec 20, 2023
- Week 3 Games - Apr 4, 2023
- Week 2 Diamond Notes - Mar 31, 2023
- PBR Illinois Player of the Week: INF/RHP Cal Sefcik - Mar 29, 2023
- 2023 Overall Rankings Update - Mar 15, 2023
- Illinois 2023 Rankings Updated - Mar 15, 2023
- 2023 Metro East Kickoff Classic: Preview - Mar 14, 2023
- Super 60: Blast Motion identifies its statistical stand-outs - Feb 14, 2023
- Illinois Players Shine at 21st Annual Super 60 - Feb 10, 2023
- 2023 Super 60: Statistical Analysis - Feb 8, 2023
- PBR Preseason ProCase: All Player Analysis - Feb 3, 2023
- Preseason ProCase: Preview - Jan 30, 2023
- Top-10 Stories of 2022: No. 6 High Level MLB Draft Follows In The IL 2023 Class - Dec 23, 2022
- Preseason Power 25 Countdown: No. 15 Marist - Mar 9, 2022
- Best of 2021: Max Infield Velocity Leaders - Jan 21, 2022
- Best of 2021: Max Exit Velocity Leaders - Jan 11, 2022
- Best of 2021: 60-Yard Dash Leaders - Jan 5, 2022
- 2021 Future Games: College Commitment Tracker - Aug 3, 2021
- Underclass Invitational: Top Overall 2023 Prospects - Jun 12, 2021
- Underclass Invitational: Infield Analysis - Jun 3, 2021
- No. 7 Marist Rallies to Beat No. 2 Brother Rice in the DISW Championship Game - Apr 19, 2021
- Underclass Invitational: Quick Hits - Mar 29, 2021
- Illinois 2023 Rankings Updated - Jan 18, 2021
- Illinois Underclass Showcase: Top Overall 2023 Prospects - Jan 7, 2021
- Underclass Showcase: Infielder Analysis - Jan 4, 2021
- Illinois Underclass Showcase: Quick Hits - Oct 27, 2020
- Illinois Fall Limited Series: Scout Blog - Oct 6, 2020
- PBR at The Rock Fall Championships: All-Underclass Teams - Sep 29, 2020
- Underclass Invitational: Infield Analysis - Apr 7, 2020
- Future Prospects Showcase - Lockport: Player Analysis - Jun 14, 2019
- Future Prospects And Educational Camp: March 4th Analysis - Apr 17, 2018
Comments
Draft Reports
Contact
Premium Content Area
To unlock contact information, you need to purchase a ScoutPLUS subscription.
Purchase Subscription OR
Login








 Sign in to view rankings
Indiana commit, ranked No. 7 in the Illinois’ 2023 class. 6-foot, 205-pounds, strong, athletic right-handed hitting infielder. Sefcik got the start on the mound and hit third in the lineup. The right-hander works from the stretch only delivery and repeats at an above-average clip while also fielding his position a handful of times during his outing. Primarily attacked with a four seam fastball that played with some ride sitting 86-88 mph, topping at 89 mph and hard breaking ball with slurve action, as a go-to putaway pitch at 68-71 mph. He rounded out his three-pitch mix with a 75-79 mph changeup that he went to on occasion. Went six scoreless innings with four strikeouts and three hits allowed. At the plate, setup in a tall and narrow stance and uses a long stride to start the swing. Strong, athletic hands with advanced bat control through the zone, powerful swing to all fields. Went 1-for-2 with two hard hit barrels and an intentional walk.
Two other Super 60 participants of note at the top of the Illinois’ 2023 class were C Colin Barczi (Naperville Central; Vanderbilt) and SS Cal Sefcik (Marist; Indiana).
Sefcik, along with the aforementioned Wolters, were two of the biggest winners from our winter circuit. Sefcik earned an invite to the Super 60 thanks to a head-turning performance at the Illinois Preseason ProCase and showed much of the same at the Super 60. Sefcik climbed seven spots and now sits at No. 7. Here is what we had on Sefcik from the Super 60:
INF Cal Sefcik (Marist, 2023; Indiana commit) may have entered the event as somewhat of a “sleeper”, but we can guarantee that his name is now known among the scouting community. Currently ranked No. 14 in the state, No. 455 nationally. Sefcik has transformed himself into one of the more physical, if not the most physical, right-handed bat in the state. The 6-foot, 205-pound, muscle-bound, right-handed hitter, stole the show during BP, putting together perhaps the most impressive rounds of the day as he led the event in average exit velocity (101.9) and max exit velocity (107.1 mph), to go along with a max distance of 390’. Sefcik peppered the middle of the field with loud backspin and lifted contact, remaining on-time consistently throughout his rounds. The right-handed hitter starts with an open setup, striding long while hanging his foot to stay in rhythm, tipping his bat slightly while landing into foot-strike with hand-separation. His path stays through the zone and flat seemingly forever, creating all kinds of backspin and rise to his up-the-middle barrels. Sefick swings with controlled aggression and quick, ultra-strong hands (26.0 mph max; 24.8 mph average) with notable bat-speed (79.5 mph max; 74.9 mph average) to create eye-opening power. His round of defense was also quite impressive, as he showed off his range laterally to pair with quick/soft hands and an athletic, crisp double play turn. As a 6.90 runner in the 60, Sefcik proved that he is more than capable of staying on the infield moving forward and should be closely followed by scouts moving forward.
Positional Profile: SS/3B
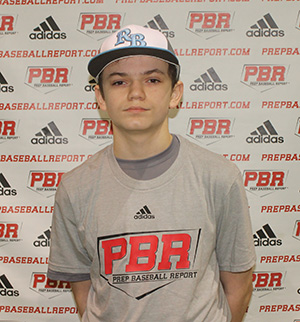
Body: 6-0, 205-pounds. Muscle-bound, physical build, continues to add quality strength to his frame.
Hit: RHH. Narrow base, long stride, bat tip loading action. Eye-opening physicality and strength in the box. Creates hand separation at footstrike, quick, strong hands with some of the best hand speed and bat speed in the class. Led the event with an average hand speed of 24.8 mph. Hands work on top of the baseball and bat stays flat and through the zone a long time. Creates advanced carry and backspin off the barrel with balls remaining true to both gaps. Loudest, most consistent hard contact of the event.
Power: 108 max exit velocity, averaged 98.5 mph. 406’ max distance.
Arm: RH. INF - 92 mph. Clean, strong arm, natural over-the-top slot with ability to change platforms. Throws play true and with carry.
Defense: Fluid, bouncy feet with soft hands. Works through the baseball and gains ground through transfer. Clean lateral mover and efficient double play turn.
Run: 6.90 runner in the 60.
Positional Profile: RHP
Delivery: Stretch only, drop/drive lower-half, explodes down the mound, rides his back leg down the mound, stride works in-line, shoulders work level.
Arm Action: RH. Slight plunge out of the glove into a high 3/4 slot. Quick arm out front.
FB: T90, 89-90 mph. Life through the zone with some carry, plays at the top of the zone. Average IVB of 12.3 (T13.7). T2212, 2081 average rpm.
CB: 74-76 mph. Sharp 11/5 shape with downer action. Landed for 100% strikes. -11.1 horizontal movement average. T2120, 2043 average rpm.
CH: 80-82 mph. Maintains armspeed, late dive to the arm-side. Average IVB of 10.2 (T13.4). Average horizontal movement of 15.6 inches (T17.2). T1995, 1818 average rpm.
Positional Profile: SS/3B
Body: 6-0, 180-pounds. Advanced, athletic frame.
Hit: RHH. Balanced setup, leg kick trigger, short stride, simple pre-pitch actions. Short, aggressive swing, under control, average bat speed of 72.9 MPH, advanced level bat path with extension, ball jumps off bat, consistent hard contact, gap-to-gap approach, advanced round of BP.
Power: 99.63 max exit velocity, averaged 84.66 mph. 363’ max distance.
Arm: RH. INF - 89 mph. Short arm action, high 3/4 arm slot, advanced arm strength for his age, best infield velocity at event
Defense: Athletic infield actions, soft hands, easy footwork, clean exchanges, plays through the ball with proper direction.
Run: 6.90 runner in the 60. Above-average runner.
Positional Profile: SS/3B; Emerging as a high-follow sophomore in the state.
Body: 5-11, 168-pounds. Lean strength, proportional build; athletic.
Hit: RHH. Athletic balance setup, minimal load trigger, quick leg kick. Quick strong hands, bat stays on plane, gets extension through contact, gap-to-gap approach, fluid rhythm. Consistent hard contact and bat speed continues to tick up. Averaged 73.6 mph of bat speed and 24.9 mph of hand speed.
Power: 88 mph exit velocity from the tee. During BP, recorded the highest average exit speed (90.1 mph) and one of the highest max exit speeds (96.4). Also recorded the furthest average and max batted-ball distances of 315 and 352 feet.
Arm: RH. INF - 87 mph. Long loose arm action, over-the-top slot.
Defense: Confident, calm actions, fluid footwork, soft hands, packs through exchange at times.
Run: 7.05 runner in the 60. Athletic, efficient runner.
5-foot-11, 168-pound, high-waisted, well-proportioned, right-handed hitting athlete/utility who continues to add quality strength to his frame. Above-average runner, plays all over the diamond; 4.44 on a groundout. Future position yet to be determined but spends the majority of his time on the infield. Arm strength continues to improve, plenty strong enough for the left-side. Offensively, twitchy, fast hands, present bat speed and aggressive swing. Open, slightly crouched setup, short stride and minimal wasted movement. Natural lift and leverage in swing. Follow 2023 athlete with upside to all parts of his game.
5-foot-11, 155-pound, wiry-strong, athletically-built, right-handed hitting infielder. Continues to see his right-handed bat ascend. Aggressive approach, developing twitch and bat speed, knack for the barrel, pull-side tendencies at times. Game speed continues to tick up. Was 4.44 down the line on a 6-3 groundout. Follow 2023 infielder with upside.
Positional Profile: SS
Body: 5-foot-11, 155-pounds. High-waisted build. Projects.
Hit: RHH. Balanced setup, pre-pitch movement in hands, smooth load, quick leg lift trigger. Bat stays level, line drive type hitter, consistent hard contact, fluid rhythm throughout.
Power: 84 mph exit velocity from the tee.
Arm: RH. INF - 75 mph. Short arm action, high 3/4 slot.
Defense: Athletic in the field, quick feet that work in rhythm, strong body control, hands play out in front.
Run: 7.43 runner in the 60.
5-10, 155 pound projectable frame. Tall, balanced set up, slightly open, occasional leg kick, short stride. Short path and stays inside the baseball. Finished the day 2-4 with a pair of doubles, four RBI, and two walks. Two-hopped the left field wall against Top Tier Nationals for a three-run double.
Positional Profile: SS/3B
Body: 5-foot-10, 130-pounds. Lean, athletic frame.
Defense: Reliable hands, quick, fluid feet, attacks the baseball, athletic actions.
Arm: RH. INF - 73 mph. Long arm action, over the top slot, throws flashed carry.
Hit: RHH. Tall, balanced set up, slightly open, strong hands, short path to the ball, stays inside the baseball, fluid rhythm.
Power: 76 mph exit velocity from the tee.
Run: 7.48 runner in the 60.
5-foot-7, 120-pound, right-handed hitting infielder, well-proportioned frame. At the plate, balanced setup, back bar load, short stride, maintains balance. Short, level bat path, simple middle of the field approach with line drive abilities, fluid rhythm involved. Exit velocity topped 70 mph from a tee. Defensively, flashed range to the ball, steady hands, arm plays long, high ¾ slot, throws topped 56 mph across with accuracy. 8.35 runner in the 60.