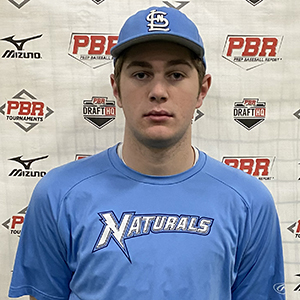
CLASS OF 2026
1B
RHP
Brody
Landgraf
Columbia (HS) • IL
 6' 4" • 231LBS
L/R • 17yr 2mo
Travel Team: U.S. Nationals
L/R • 17yr 2mo
Travel Team: U.S. Nationals
Rankings
2026 National
Rankings available to Premium Subscriber
2026 State
Rankings available to Premium Subscriber
Commitment
Best Of Stats
26.1
Hand Speed (max)
7/24/24
61.7
Bat Speed (max)
7/24/24
13.3
Rot. Acc (max)
7/24/24
40
Hard Hit %
1/21/24
97.8
Exit Velocity (max)
7/24/24
86.8
Exit Velocity (avg)
1/21/24
322
Distance (max)
7/24/24
50
Sweet Spot %
1/21/24
7.29
60
7/24/24
3.98
30-yd
7/24/24
1.7
10-yd
7/24/24
18.6
Run speed (max)
7/24/24
77
INF Velo
7/24/24
-
OF Velo
-
C Velo
-
Pop Time
Fastball
79.4
Velocity (max)
1/21/24
78.6 - 79.4
Velo Range
1/21/24
1678
Spin Rate (avg)
1/21/24
Changeup
67.1 - 69.5
Velo Range
1/21/24
1036
Spin Rate (avg)
1/21/24
Curveball
67.3 - 68.7
Velo Range
1/21/24
1712
Spin Rate (avg)
1/21/24
Positional Tools
2024
2022
Home to First
The athlete's fastest home-to-first time in the given event year. Measured from bat-on-ball to foot-on-bag, in seconds (s).
4.0
Infield Velocity
The athlete's maximum throwing velocity from an infield position in the given event year. Measured in miles per hour (MPH).
77.0
Home to First
The athlete's fastest home-to-first time in the given event year. Measured from bat-on-ball to foot-on-bag, in seconds (s).
4.26
Infield Velocity
The athlete's maximum throwing velocity from an infield position in the given event year. Measured in miles per hour (MPH).
74.0
Hitting

2024
Exit Velocity Max
The highest exit velocity of any batted ball in the given event year. Measured in miles per hour (MPH).
97.8
Exit Velocity Avg
Average exit velocity of all batted balls in the given event year. Measured in miles per hour (MPH).
85.2
Distance Max
The highest flight distance of any batted ball in the given event year. Measured in feet (ft).
322
Distance Avg
Average flight distance of all batted balls in the given event year. Measured in feet (ft).
203
Launch Angle Avg
Average launch angle of all batted balls in the given event year. Measured in degrees.
24.5
Hard Hit %
Percentage of batted balls with exit velocities over 95 MPH in the given event year.
Sweet Spot %
Percentage of batted balls in the given event year with a launch angle between 8° and 32°.
Line Drive %
Percentage of batted balls with launch angles between 10 and 25 degrees in the given event year.
Fly Ball %
Percentage of batted balls with launch angles between 25 and 50 degrees in the given event year.
Ground Ball %
Percentage of batted balls with launch angles below 10 degrees in the given event year.
Future Games (Class of 2026/27)
Jul 24, 2024
Trackman - Hitting
97.8
Exit Velocity (max)
83.6
Exit Velocity (avg)
175
Distance (avg)
322
Distance (max)
Hard Hit %
Sweet Spot %
Fly Ball %
Ground Ball %
US Nationals & Affiliates
Jan 21, 2024
Trackman - Hitting
95.9
Exit Velocity (max)
86.8
Exit Velocity (avg)
233
Distance (avg)
293
Distance (max)
Hard Hit %
Sweet Spot %
Line Drive %
Fly Ball %
Ground Ball %
Hitting

2024
Hand Speed Max
The highest Peak Hand Speed of any swing in the given event year.
26.1
Hand Speed Avg
The average Peak Hand Speed for all swings in the given event year.
23.4
Bat Speed Max
The highest Bat Speed of any swing in the given event year.
61.7
Bat Speed Avg
The average Bat Speed for all swings in the given event year.
60.2
Rotational Acceleration Max
The highest Rotational Acceleration of any swing in the given event year.
Rotational Acceleration Avg
The average Rotational Acceleration for all swings in the given event year.
On-Plane Efficiency Max
The highest On-Plane Efficiency of any swing in the given event year.
On-Plane Efficiency Avg
The average On-Plane Efficiency for all swings in the given event year.
Future Games (Class of 2026/27)
Jul 24, 2024
Blast - Hitting
26.1
Hand Speed (max)
23.4
Hand Speed (avg)
61.7
Bat Speed (max)
60.2
Bat Speed (avg)
Rot. Acc (max)
Rot. Acc (avg)
On Plane Eff (avg)
MaxOnPlaneEfficiency
Pitching

2024
Fastball
Velocity Max
The maximum observed fastball velocity in the given event year. Measured in miles per hour (MPH).
79.4
Fastball
Velocity Avg
The average velocity for all pitches of this type in the given event year. Measured in miles per hour (MPH).
79.0
Fastball
Spin Rate Avg
The average rate of spin for all pitches of this type in the given event year. Measured in rotations per minute (RPM).
1678
Fastball
Spin Score Avg
The average Bauer Units value of all fastballs in the given event year. Bauer Units are calculated for each pitch by dividing Spin Rate by Velocity.
21.2
Fastball
Total Movement Avg
The average total non-gravity movement for all pitches of this type in the given event year. Measured in inches (in).
Curveball
Velocity Avg
The average velocity for all pitches of this type in the given event year. Measured in miles per hour (MPH).
68.0
Curveball
Spin Rate Avg
The average rate of spin for all pitches of this type in the given event year. Measured in rotations per minute (RPM).
1712
Curveball
Total Movement Avg
The average total non-gravity movement for all pitches of this type in the given event year. Measured in inches (in).
Changeup
Velocity Avg
The average velocity for all pitches of this type in the given event year. Measured in miles per hour (MPH).
68.3
Changeup
Spin Rate Avg
The average rate of spin for all pitches of this type in the given event year. Measured in rotations per minute (RPM).
1036
Changeup
Total Movement Avg
The average total non-gravity movement for all pitches of this type in the given event year. Measured in inches (in).
US Nationals & Affiliates
Jan 21, 2024
Trackman - Fastball
79.4
Velocity (max)
78.6 - 79.4
Velo Range
77.2
Eff Velocity (avg)
1,734
Spin Rate (max)
1,678
Spin Rate (avg)
IVB (max)
IVB (avg)
HM (max)
HM (avg)
Extension (avg)
Release Ht (avg)
Spin Score (max)
Zone %
Spin Efficiency % (avg)
Trackman - Curveball
68.7
Velocity (max)
67.3 - 68.7
Velo Range
65.9
Eff Velocity (avg)
1,782
Spin Rate (max)
1,712
Spin Rate (avg)
IVB (max)
IVB (avg)
HM (max)
HM (avg)
Extension (avg)
Release Ht (avg)
Spin Score (max)
Zone %
Spin Efficiency % (avg)
Trackman - ChangeUp
69.5
Velocity (max)
67.1 - 69.5
Velo Range
66.2
Eff Velocity (avg)
1,085
Spin Rate (max)
1,036
Spin Rate (avg)
IVB (max)
IVB (avg)
HM (max)
HM (avg)
Extension (avg)
Release Ht (avg)
Spin Score (max)
Spin Efficiency % (avg)
Pitch Scores
Pitching Velos
2022
Fastball
Velocity Max
The maximum observed fastball velocity in the given event year. Measured in miles per hour (MPH).
79.0
Fastball
Velocity Avg
The average velocity for all pitches of this type in the given event year. Measured in miles per hour (MPH)
76.5
Curveball
Velocity Avg
The average velocity for all pitches of this type in the given event year. Measured in miles per hour (MPH)
59.5
Changeup
Velocity Avg
The average velocity for all pitches of this type in the given event year. Measured in miles per hour (MPH)
63.0
Game Performance

2024
10 Yard Dash
The athlete's fastest 0-10-yard split time in the given event year. Measured in seconds.
1.70
30 Yard Dash
The athlete's fastest 0-30-yard split time in the given event year. Measured in seconds.
3.98
60 Yard Dash
The athlete's fastest 0-60-yard time in the given event year. Measured in seconds.
7.29
Top Speed (MPH)
The athlete's fastest split time converted to miles per hour.
RSi
The reactive strength index measurement of an athlete's explosiveness by comparing their jump height to the ground contact time in between their jumps. On a scale of 0-5.
Vertical Jump
A measure of any athlete's body strength and reach calculated from the flight time divided by the contact time.
Future Games (Class of 2026/27)
Jul 24, 2024
Swift
1.70
10-yd
3.98
30-yd
7.29
60-yd
18.6
Run speed (max)
1.59
RSi (max)
28.3
Jump Height (max)
Visual Edge

2024
Edge Score
The highest Edge Score within the given year. Edge Score is a comprehensive score that takes the core-six visual skills into account, providing an assessment of an athlete’s overall visual ability.
74.69
Pitch Ai

Notes
News
- Illinois 2026 Rankings: Risers - Sep 5, 2024
- Illinois 2026 Rankings Updated - Sep 4, 2024
- Team Illinois Future Games: Takeaways - Aug 12, 2024
- US Nationals & Affiliates (St. Louis) Scout Day: Takeaways - Mar 4, 2024
- Illinois 2026 Rankings: Update - Dec 6, 2023
- Illinois 2026 Rankings: Update - Sep 6, 2023
- IHSA Playoff Scout Blog - Jun 26, 2023
- 1A/2A State Playoff Semifinals Recap - Jun 3, 2023
- 2A IHSA State Finals Preview - Jun 1, 2023
- Updated Illinois 2026 Rankings - May 24, 2023
- Week 9 Games - May 18, 2023
- IHSA 1A & 2A Playoff Preview: Teams To Know - May 16, 2023
- Week 5 Diamond Notes - Apr 21, 2023
- Week 1 Games - Mar 20, 2023
- Inside the Illinois 2026 Rankings: Names To Know - Nov 16, 2022
Comments
Draft Reports
Contact
Premium Content Area
To unlock contact information, you need to purchase a ScoutPLUS subscription.
Purchase Subscription OR
Login
Physical
2024
Grip Strgth (LH)
Grip strength is a measure of a players bat control and ability to transfer power and speed during impact, measured in pounds of force generated; collected with elbow bent at 90 degrees.
Grip Strgth (RH)
Grip strength is a measure of a players bat control and ability to transfer power and speed during impact, measured in pounds of force generated; collected with elbow bent at 90 degrees.


 Sign in to view rankings
2024 Future Games: Brody Landgraf (Columbia) proved to be a threat with the bat during his week at the Future Games. The big, 6-foot-4, 231-pound first baseman has all kinds of strength in his frame. His eye-opening performance came in the nightcap of Team Illinois’ final game on Saturday night, where he earned the Dicks Sporting Goods Player of the Game honors after going 4-for-4 with two RBI and two stolen bases. He took quality at-bats throughout the game, working counts, fouling off pitches, and creating tough outs for pitchers. Landgraf has power in his left-handed bat, showing the ability to barrel balls to the pull-side, and during Wednesday’s showcase, he posted a max exit velocity of 97.8 mph. He remains an uncommitted follow after the event.
Ranked No. 10 in Illinois’ incoming sophomore class. Stands at an impressive 6-foot-5, 200-pounds, still more strength coming. Was the DH and batted fourth. A left-handed hitter, Landgraf has above-average bat speed and power for his age, quick and direct with an uphill path, drives the ball to all fields, tough out. Put Columbia on the board in the first inning of the semifinal game against DePaul College Prep with an RBI triple to the right/center gap. In the fifth inning, he blasted an RBI double to center field for another RBI. He finished the game 2-for-2 with a triple, double, two RBIs, one run scored and a walk. Landgraf is one of the top bats in the state’s class of 2026.
Physical 6-foot-5, 200-pound athlete with a body capable of further filling out as he gets older. Left-handed bat that started at first base and hit in the six-hole for the Eagles. Generates easy bat and hand speed from the left side, staying flat and in the zone throughout. Found the barrel with authority twice in this look - a deep line out to the opposite field and a no-doubt line drive home run over the right field fence in a key situation. Runs well for his size, moves around the bag comfortably in I/O. Also played varsity basketball this winter as a freshman. A name-to-know prospect in the Illinois’ 2026 class.
The freshman went 8-for-17 (.471 BA/1.289 OPS) with a home run, triple, nine RBIs, and eight runs scored.
Season Stats: (.476 BA/.500 OBP/.711 SLG), HR, 2 3B, 4 2B, 18 RBI, 15 R
6-foot-4, 195-pound highly projectable frame with present strength and room to add more. Started at first base for Columbia in this look. Also saw playing time for the Eagles varsity basketball team as a freshman, shooting 63.9% from the field and grabbing 141 rebounds over 33 games played. Tall at the plate with some knee bend, hands start at midline and work back at load, quick hitch with a toe-tap trigger. Long flat left-handed swing, hard off the barrel. Flicked a deep flyout to center field off balance in his second at-bat, drove a double into the opposite field gap in his following appearance. Projects to impact the baseball more consistently as he matures. Comfortably moved around first base in pregame with footwork feel and sure-handed actions. A name-to-know in the Illinois’ 2026 class.