CLASS OF 2025
RHP
1B
Connor
Blue
O'Fallon (HS) • IL
6' 2" • 205LBS
R/R • 18yr 2mo
Travel Team: GBA
6' 2" • 205LBS
R/R • 18yr 2mo
Travel Team: GBA
Rankings
2025 National
Rankings available to Premium Subscriber
2025 State
Rankings available to Premium Subscriber
Commitment
Best Of Stats
Fastball
91
Velocity (max)
2/11/24
88 - 91
Velo Range
2/11/24
2223
Spin Rate (avg)
7/26/23
Changeup
80 - 81
Velo Range
2/11/24
1407
Spin Rate (avg)
7/26/23
Curveball
74 - 78
Velo Range
3/11/24
-
Spin Rate (avg)
Slider
73.6 - 75.1
Velo Range
7/26/23
2372
Spin Rate (avg)
8/09/22
100
Exit Velocity (max)
2/11/23
91.6
Exit Velocity (avg)
2/11/23
347
Distance (max)
2/11/23
88
Sweet Spot %
2/11/23
22.9
Hand Speed (max)
8/09/22
71.7
Bat Speed (max)
8/09/22
10.3
Rot. Acc (max)
8/09/22
63
Hard Hit %
2/11/23
7.19
60
8/09/22
4.01
30-yd
2/11/23
1.74
10-yd
2/11/23
19.1
Run speed (max)
2/11/23
80
INF Velo
5/29/22
-
OF Velo
-
C Velo
-
Pop Time
Positional Tools
2023
2022
2021
60 Yard Dash
The athlete's fastest 60-yard dash time in the given event year. Measured in seconds (s)
7.22
Power / Speed Score
A simple calculation that divides the athlete’s Exit Velocity Max by the athlete’s 60 Yard Dash time for the given event year. For example, 98 MPH / 7.00s = 14.00.
13.9
60 Yard Dash
The athlete's fastest 60-yard dash time in the given event year. Measured in seconds (s)
7.19
Infield Velocity
The athlete's maximum throwing velocity from an infield position in the given event year. Measured in miles per hour (MPH).
80.0
Power / Speed Score
A simple calculation that divides the athlete’s Exit Velocity Max by the athlete’s 60 Yard Dash time for the given event year. For example, 98 MPH / 7.00s = 14.00.
12.7
60 Yard Dash
The athlete's fastest 60-yard dash time in the given event year. Measured in seconds (s)
7.90
Infield Velocity
The athlete's maximum throwing velocity from an infield position in the given event year. Measured in miles per hour (MPH).
71.0
Power / Speed Score
A simple calculation that divides the athlete’s Exit Velocity Max by the athlete’s 60 Yard Dash time for the given event year. For example, 98 MPH / 7.00s = 14.00.
9.7
Hitting

2023
2022
Exit Velocity Max
The highest exit velocity of any batted ball in the given event year. Measured in miles per hour (MPH).
100.0
Exit Velocity Avg
Average exit velocity of all batted balls in the given event year. Measured in miles per hour (MPH).
91.6
Distance Max
The highest flight distance of any batted ball in the given event year. Measured in feet (ft).
347
Distance Avg
Average flight distance of all batted balls in the given event year. Measured in feet (ft).
263
Launch Angle Avg
Average launch angle of all batted balls in the given event year. Measured in degrees.
22.2
Hard Hit %
Percentage of batted balls with exit velocities over 95 MPH in the given event year.
Sweet Spot %
Percentage of batted balls in the given event year with a launch angle between 8° and 32°.
Line Drive %
Percentage of batted balls with launch angles between 10 and 25 degrees in the given event year.
Fly Ball %
Percentage of batted balls with launch angles between 25 and 50 degrees in the given event year.
Ground Ball %
Percentage of batted balls with launch angles below 10 degrees in the given event year.
Exit Velocity Max
The highest exit velocity of any batted ball in the given event year. Measured in miles per hour (MPH).
91.0
Exit Velocity Avg
Average exit velocity of all batted balls in the given event year. Measured in miles per hour (MPH).
86.4
Distance Max
The highest flight distance of any batted ball in the given event year. Measured in feet (ft).
341
Distance Avg
Average flight distance of all batted balls in the given event year. Measured in feet (ft).
259
Launch Angle Avg
Average launch angle of all batted balls in the given event year. Measured in degrees.
26.5
Hard Hit %
Percentage of batted balls with exit velocities over 95 MPH in the given event year.
Sweet Spot %
Percentage of batted balls in the given event year with a launch angle between 8° and 32°.
Line Drive %
Percentage of batted balls with launch angles between 10 and 25 degrees in the given event year.
Fly Ball %
Percentage of batted balls with launch angles between 25 and 50 degrees in the given event year.
Ground Ball %
Percentage of batted balls with launch angles below 10 degrees in the given event year.
GBA Scout Day 2023
Feb 11, 2023
Trackman - Hitting
100.0
Exit Velocity (max)
91.6
Exit Velocity (avg)
263
Distance (avg)
347
Distance (max)
Hard Hit %
Sweet Spot %
Line Drive %
Fly Ball %
Illinois State Games (Invite-Only)
Aug 9, 2022
Trackman - Hitting
91.0
Exit Velocity (max)
86.4
Exit Velocity (avg)
259
Distance (avg)
341
Distance (max)
Hard Hit %
Sweet Spot %
Line Drive %
Fly Ball %
Ground Ball %
Hitting

2022
Hand Speed Max
The highest Peak Hand Speed of any swing in the given event year.
22.9
Hand Speed Avg
The average Peak Hand Speed for all swings in the given event year.
21.0
Bat Speed Max
The highest Bat Speed of any swing in the given event year.
71.7
Bat Speed Avg
The average Bat Speed for all swings in the given event year.
66.9
Rotational Acceleration Max
The highest Rotational Acceleration of any swing in the given event year.
Rotational Acceleration Avg
The average Rotational Acceleration for all swings in the given event year.
On-Plane Efficiency Max
The highest On-Plane Efficiency of any swing in the given event year.
On-Plane Efficiency Avg
The average On-Plane Efficiency for all swings in the given event year.
Illinois State Games (Invite-Only)
Aug 9, 2022
Blast - Hitting
22.9
Hand Speed (max)
21.0
Hand Speed (avg)
71.7
Bat Speed (max)
66.9
Bat Speed (avg)
Rot. Acc (max)
Rot. Acc (avg)
On Plane Eff (avg)
MaxOnPlaneEfficiency
Pitching

2023
2022
Fastball
Velocity Max
The maximum observed fastball velocity in the given event year. Measured in miles per hour (MPH).
89.2
Fastball
Velocity Avg
The average velocity for all pitches of this type in the given event year. Measured in miles per hour (MPH).
88.3
Fastball
Spin Rate Avg
The average rate of spin for all pitches of this type in the given event year. Measured in rotations per minute (RPM).
2223
Fastball
Spin Score Avg
The average Bauer Units value of all fastballs in the given event year. Bauer Units are calculated for each pitch by dividing Spin Rate by Velocity.
25.2
Fastball
Total Movement Avg
The average total non-gravity movement for all pitches of this type in the given event year. Measured in inches (in).
Changeup
Velocity Avg
The average velocity for all pitches of this type in the given event year. Measured in miles per hour (MPH).
77.0
Changeup
Spin Rate Avg
The average rate of spin for all pitches of this type in the given event year. Measured in rotations per minute (RPM).
1407
Changeup
Total Movement Avg
The average total non-gravity movement for all pitches of this type in the given event year. Measured in inches (in).
Slider
Velocity Avg
The average velocity for all pitches of this type in the given event year. Measured in miles per hour (MPH).
74.2
Slider
Spin Rate Avg
The average rate of spin for all pitches of this type in the given event year. Measured in rotations per minute (RPM).
2256
Slider
Total Movement Avg
The average total non-gravity movement for all pitches of this type in the given event year. Measured in inches (in).
Fastball
Velocity Max
The maximum observed fastball velocity in the given event year. Measured in miles per hour (MPH).
85.7
Fastball
Velocity Avg
The average velocity for all pitches of this type in the given event year. Measured in miles per hour (MPH).
83.7
Fastball
Spin Rate Avg
The average rate of spin for all pitches of this type in the given event year. Measured in rotations per minute (RPM).
2175
Fastball
Spin Score Avg
The average Bauer Units value of all fastballs in the given event year. Bauer Units are calculated for each pitch by dividing Spin Rate by Velocity.
26.0
Fastball
Total Movement Avg
The average total non-gravity movement for all pitches of this type in the given event year. Measured in inches (in).
Changeup
Velocity Avg
The average velocity for all pitches of this type in the given event year. Measured in miles per hour (MPH).
72.5
Changeup
Spin Rate Avg
The average rate of spin for all pitches of this type in the given event year. Measured in rotations per minute (RPM).
1347
Changeup
Total Movement Avg
The average total non-gravity movement for all pitches of this type in the given event year. Measured in inches (in).
Slider
Velocity Avg
The average velocity for all pitches of this type in the given event year. Measured in miles per hour (MPH).
70.8
Slider
Spin Rate Avg
The average rate of spin for all pitches of this type in the given event year. Measured in rotations per minute (RPM).
2372
Slider
Total Movement Avg
The average total non-gravity movement for all pitches of this type in the given event year. Measured in inches (in).
2023 PBR Future Games
Jul 26, 2023
Trackman - Fastball
89.2
Velocity (max)
87.7 - 88.8
Velo Range
86.8
Eff Velocity (avg)
2,309
Spin Rate (max)
2,223
Spin Rate (avg)
IVB (max)
IVB (avg)
HM (max)
HM (avg)
Extension (avg)
Release Ht (avg)
Spin Score (max)
Zone %
Trackman - Slider
75.8
Velocity (max)
73.6 - 75.1
Velo Range
72.3
Eff Velocity (avg)
2,376
Spin Rate (max)
2,256
Spin Rate (avg)
IVB (max)
IVB (avg)
HM (max)
HM (avg)
Extension (avg)
Release Ht (avg)
Spin Score (max)
Zone %
Trackman - ChangeUp
78.6
Velocity (max)
75.8 - 78.4
Velo Range
76.3
Eff Velocity (avg)
1,474
Spin Rate (max)
1,407
Spin Rate (avg)
IVB (max)
IVB (avg)
HM (max)
HM (avg)
Extension (avg)
Release Ht (avg)
Spin Score (max)
Zone %
Illinois State Games (Invite-Only)
Aug 9, 2022
Trackman - Fastball
85.7
Velocity (max)
82.4 - 84.9
Velo Range
80.5
Eff Velocity (avg)
2,318
Spin Rate (max)
2,175
Spin Rate (avg)
IVB (max)
IVB (avg)
HM (max)
HM (avg)
Extension (avg)
Release Ht (avg)
Spin Score (max)
Zone %
Trackman - Slider
71.9
Velocity (max)
69.9 - 71.6
Velo Range
67.3
Eff Velocity (avg)
2,547
Spin Rate (max)
2,372
Spin Rate (avg)
IVB (max)
IVB (avg)
HM (max)
HM (avg)
Extension (avg)
Release Ht (avg)
Spin Score (max)
Zone %
Trackman - ChangeUp
74.3
Velocity (max)
71.0 - 74.1
Velo Range
70.2
Eff Velocity (avg)
1,408
Spin Rate (max)
1,347
Spin Rate (avg)
IVB (max)
IVB (avg)
HM (max)
HM (avg)
Extension (avg)
Release Ht (avg)
Spin Score (max)
Pitch Scores
Pitching Velos
2024
2023
2022
2021
Fastball
Velocity Max
The maximum observed fastball velocity in the given event year. Measured in miles per hour (MPH).
91.0
Fastball
Velocity Avg
The average velocity for all pitches of this type in the given event year. Measured in miles per hour (MPH)
89.2
Curveball
Velocity Avg
The average velocity for all pitches of this type in the given event year. Measured in miles per hour (MPH)
75.5
Changeup
Velocity Avg
The average velocity for all pitches of this type in the given event year. Measured in miles per hour (MPH)
80.5
Fastball
Velocity Max
The maximum observed fastball velocity in the given event year. Measured in miles per hour (MPH).
89.0
Fastball
Velocity Avg
The average velocity for all pitches of this type in the given event year. Measured in miles per hour (MPH)
86.5
Curveball
Velocity Avg
The average velocity for all pitches of this type in the given event year. Measured in miles per hour (MPH)
71.5
Fastball
Velocity Max
The maximum observed fastball velocity in the given event year. Measured in miles per hour (MPH).
86.0
Fastball
Velocity Avg
The average velocity for all pitches of this type in the given event year. Measured in miles per hour (MPH)
82.2
Changeup
Velocity Avg
The average velocity for all pitches of this type in the given event year. Measured in miles per hour (MPH)
71.8
Slider
Velocity Avg
The average velocity for all pitches of this type in the given event year. Measured in miles per hour (MPH)
69.2
Fastball
Velocity Max
The maximum observed fastball velocity in the given event year. Measured in miles per hour (MPH).
72.0
Fastball
Velocity Avg
The average velocity for all pitches of this type in the given event year. Measured in miles per hour (MPH)
72.0
Curveball
Velocity Avg
The average velocity for all pitches of this type in the given event year. Measured in miles per hour (MPH)
56.5
Game Performance

2023
2022
10 Yard Dash
The athlete's fastest 0-10-yard split time in the given event year. Measured in seconds.
1.74
30 Yard Dash
The athlete's fastest 0-30-yard split time in the given event year. Measured in seconds.
4.01
60 Yard Dash
The athlete's fastest 0-60-yard time in the given event year. Measured in seconds.
7.22
Top Speed (MPH)
The athlete's fastest split time converted to miles per hour.
RSi
The reactive strength index measurement of an athlete's explosiveness by comparing their jump height to the ground contact time in between their jumps. On a scale of 0-5.
Vertical Jump
A measure of any athlete's body strength and reach calculated from the flight time divided by the contact time.
Illinois State Games (Invite-Only)
Aug 9, 2022
Swift
1.77
10-yd
4.00
30-yd
7.19
60-yd
19.3
Run speed (max)
8.3
Run Speed (avg)
1.44
RSi (max)
1.44
RSi (avg)
1,449
Jump Power (max)
25.8
Jump Height (max)
25.3
Jump Height (avg)
Visual Edge

2022
Edge Score
The highest Edge Score within the given year. Edge Score is a comprehensive score that takes the core-six visual skills into account, providing an assessment of an athlete’s overall visual ability.
70.35
Pitch Ai

2022
Arm Speed
The maximum speed, in the direction of home plate, that the wrist is traveling. Measured in meters per second (m/s)
Arm Slot
Angle of the forearm relative to the ground between maximum external rotation (MER) and ball release (BR). Which can be a powerful player comparison metric, delivered in degrees.
Knee Extension Velo
The angular velocity of the front knee straightening after foot plant, which provides indicators of velocity potential. Measured in degrees per second.
Deception
The amount of time that the ball is visible to the hitter, after the instant of front foot strike. Measures in milliseconds.
Hip-Shoulder Separation
The difference in angle of between the hips and shoulders, occurring close to the foot plant. Measured in degrees.
Illinois State Games (Invite-Only)
Aug 9, 2022
ProPlayAI - Foot Plant
Elbow Flexion (avg)
Shoulder Abduction (avg)
Hip Shoulder Seperation (avg)
ProPlayAI - MER
External Rotation (avg)
Stride Length (avg)
ProPlayAI - Release
Arm Speed (max)
Arm Speed (avg)
Knee Extension Velocity (max)
Knee Extension Velocity (avg)
Knee Flexion (avg)
Arm Slot (avg)
Lateral Trunk Tilt (avg)
Arm Path (avg)
Deception (avg)
Torque (avg)
Efficiency (avg)
Sequencing (avg)
Notes
News
- Illinois 2025 Rankings: Risers - Aug 29, 2024
- 2024 Playoff Scout Blog - Jun 5, 2024
- Illinois 2025 Rankings Updated - Mar 27, 2024
- 2024 Metro East Kickoff Classic: Scout Blog - Mar 24, 2024
- Preseason Power 25 Countdown: No. 13 O'Fallon - Mar 8, 2024
- GBA Scout Day Quick Hits: Pitchers & Two-Ways - Feb 14, 2024
- Top-10 Stories of 2023: No. 9 Team Illinois at the 2023 Future Games - Dec 19, 2023
- Q&A With Cincinnati Commit Connor Blue - Dec 12, 2023
- Recruiting Roundup: Week of 10/29 - Nov 3, 2023
- Illinois Class of 2025 Rankings: Risers - Aug 31, 2023
- Team Illinois: Takeaways - Aug 1, 2023
- 2023 Future Games Preview: Team Illinois - Jul 24, 2023
- IHSA Playoff Scout Blog - Jun 26, 2023
- Week 9 Games - May 18, 2023
- Illinois Power 25: Early Takeaways - Mar 27, 2023
- 2023 Metro East Kickoff Classic: Preview - Mar 14, 2023
- GBA Scout Day: Quick Hits - Feb 15, 2023
- Illinois Class of 2025 Rankings Update - Aug 31, 2022
- Illinois State Games: Takeaways - Aug 15, 2022
- Illinois State Games: Roster Preview - Aug 4, 2022
Comments
Draft Reports
Contact
Premium Content Area
To unlock contact information, you need to purchase a ScoutPLUS subscription.
Purchase Subscription OR
Login





 Sign in to view rankings
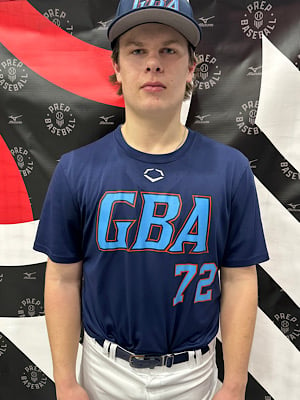
Cincinnati commit, 6-foot-2, 205-pound frame that holds lean strength throughout. Ranked No. 17 overall in the state’s junior class and No. 491 overall nationally. Tossed six innings of one run ball for the Panthers in a regional win, scattering three hits with three walks and five strikeouts. Simple, stretch-only operation, leans into his backside and rides it downhill, lead leg swings to front footstrike. Strong glove arm, drifts towards the first base side through release. Clean and continuous path on the backside, gets into scap retraction and fires out of a high ¾ slot. Fastball played at 90-91 mph in the first inning, pitched anywhere from 86-89 mph as he went on, but did reach back for 89 mph in each of the final two frames of his outing. Showed a low-70s curveball as his main secondary offering, sharp spin at times. Served as more of a change-of-pace in this look, kept hitters off balance and stayed off the barrel; did induce three ground ball double plays with his breaking ball. One of the top arms in the state’s soon-to-be senior class.
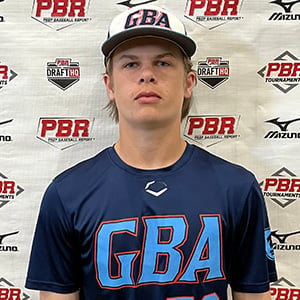
Cincinnati commit, ranked No. 28 overall in the state’s junior class though set to rise in our upcoming update. Strong, well-proportioned frame. Started on the mound for the Panthers in their matchup with top-ranked Brother Rice. Simple, stretch-only delivery. Stacks onto his backside early and rides it down the mound to front footstrike; efficient mover, excels at staying connected to the rubber. Athletic in-line finish, drifts towards the first base side after release. Long arm action, high ¾ finish, loose out front. Fastball touched 91 twice, held 88-90 mph, late life and jump at times. Spins one of the best breaking balls in Illinois; sharp swing-and-miss bite in the low-to-mid-70s. Consistently grabbed whiffs out of the strike zone, feel to land it for strikes when needed. Power arm with swing-and-miss stuff that’s one of the top arms in the Illinois’ 2025 class.
Verbally committed to Cincinnati.
RHP Connor Blue (O’Fallon, 2025) was impressive in his lone inning of work, punching out a pair in Saturday’s outing. At 6-foot-1, 190-pounds, Blue’s fastball played in the upper-80s, touching 89 mph, from a fast ¾ slot. His aptitude to spin is his calling card and Blue ripped off several swing-and-miss mid-70s sliders with tight, late break that grabbed chase out of the zone, particularly to right-handed hitters. He also mixed in a low spin changeup (1500 RPM) at 74-75 mph to left-handed bats, showing a true three-pitch mix in his brief stint. Like his counterparts, Blue also came away from this event as a name-to-know arm in the state’s 2025 group.
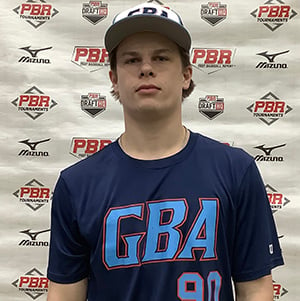
Well-proportioned 6-foot-1, 185-pound athlete with present strength and room to add more as he continues to physically mature. Took the mound against a potent Edwardsville offense and held his own through four innings, showing his loudest stuff to date. Worked exclusively out of the stretch, stacks onto his backside from a simple start, drop/drive mover downhill, stays connected to the rubber and rotates onto his lead leg at front footstrike. Works slightly across body, momentum carries out front and throws with some effort through release. Short arm stroke, high ¾ slot with arm speed out front. Fastball touched 89 in the first, held 85-88 mph throughout with carry up in the zone and late upper-quadrant arm-side life on occasion. Continues to spin his breaking ball at an advanced rate, showing sharp, downer action at 70-73 mph off an 11/5 plane with swing-and-miss upside at the next level. Progressively impressed over three live looks as the spring went on and remains one of the top prospects in the Illinois’ 2025 class.
Strong, well-proportioned 6-foot-1, 185-pound athlete with room for continued physical maturity. Took the mound for the Panthers in a conference matchup and was excellent - scattered three hits over six shutout innings, punching out seven in a win. Stretch only, works fairly upright throughout his delivery, stays connected with the rubber and rotates at front footstrike. Easy operation without much effort. Short and compact arm action that finishes from a ¾ slot with arm speed and acceleration out front. Fastball touched 87 early, holding 84-86 mph throughout with late life and sizzle at times. Continues to show advanced feel to spin the baseball, ripping off a 70-73 mph breaking ball that flashed sharp, late swing-and-miss action, grabbing whiffs to the glove-side in particular. A high-end sophomore arm in the state.
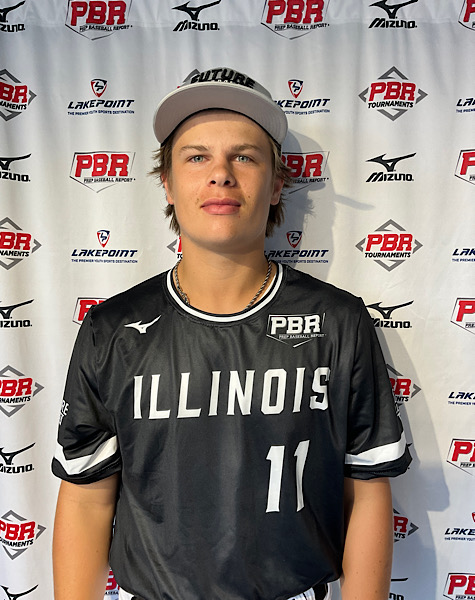
RHP/1B Connor Blue (O’Fallon, 2025) intrigued our staff on both sides of the ball at this event. A strong 5-foot-11, 170-pound athlete, Blue worked gap-to-gap with ease in BP, generating deep, elevated contact (259 ft.) on average and clobbering his furthest batted ball 341 feet, per TrackMan. He hopped on the mound Tuesday night and showcased loud stuff for his age, pumping his fastball at 83-86 mph while spinning a sharp low-70s slider at 2,372 RPM on average, peaking at 2,547 RPM. Headed into his sophomore year at O’Fallon, Blue is certainly a name-to-know prospect from Southern Illinois.
Positional Profile: RHP/1B
Body: 6-0, 180-pounds. Wide-shouldered, strong overall build.
Delivery: Easy effort, medium leg-lift into balance point, drop/drive lower-half that remains in-line with the plate, shoulders stay level throughout stride.
Arm Action: RH. Long out of the glove into a loose 3/4 slot, quick arm.
FB: T85.7, 83-85 mph. Explodes through the zone with arm-side run, showed some feel for the corners. T2318, 2182 average rpm.
SL: 70-72 mph. Sharp 10/4 shape with sweeping action. T2547, 2372 average rpm.
CH: 71-74 mph. Fades heavily at times to the arm-side, maintains arm-speed. T1408, 1347 average rpm.
Positional Profile: RHP/1B
Body: 6-0, 180-pounds. Wide-shouldered, strong overall build.
Hits: RHH. Tall, balanced setup, early short stride. Short path, uphill tendencies, strong hands, on the barrel.
Power: 91 max exit velocity, averaged 86.4 MPH. 341' max distance.
Arm: RH. INF-79 mph.Long arm action, high 3/4 slot, plays accurate.
Defense: Bouncy defender, athletic for his age and position. Soft hands and feel for the position.
Run: 7.19 runner in the 60.
Vizual Edge: 70.35 Edge Score
Positional Profile: RHP/1B
Body: 6-0, 180-pounds. Wide-shouldered, strong overall build.
Delivery: Easy effort, medium leg-lift into balance point, drop/drive lower-half that remains in-line with the plate, shoulders stay level throughout stride.
Arm Action: RH. Long out of the glove into a loose 3/4 slot, quick arm.
FB: T85.7, 83-85 mph. Explodes through the zone with arm-side run, showed some feel for the corners. T2318, 2182 average rpm.
SL: 70-72 mph. Sharp 10/4 shape with sweeping action. T2547, 2372 average rpm.
CH: 71-74 mph. Fades heavily at times to the arm-side, maintains arm-speed. T1408, 1347 average rpm.
Positional Profile: RHP/1B
Body: 6-0, 180-pounds. Wide-shouldered, strong overall build.
Hits: RHH. Tall, balanced setup, early short stride. Short path, uphill tendencies, strong hands, on the barrel.
Power: 91 max exit velocity, averaged 86.4 MPH. 341' max distance.
Arm: RH. INF-79 mph.Long arm action, high 3/4 slot, plays accurate.
Defense: Bouncy defender, athletic for his age and position. Soft hands and feel for the position.
Run: 7.19 runner in the 60.
Vizual Edge: 70.35 Edge Score