CLASS OF 2024
2B
3B
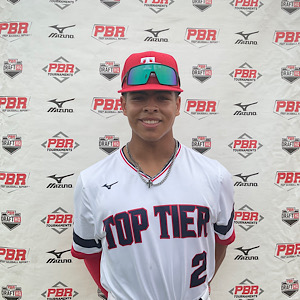
Jaden
Obaldo
McHenry County JC
Crystal Lake Central (HS) • IL
 5' 10" • 179.7LBS
R/R • 18yr 11mo
Travel Team: Top Tier North 2024
Crystal Lake Central (HS) • IL
R/R • 18yr 11mo
Travel Team: Top Tier North 2024
Rankings
2024 National
Rankings available to Premium Subscriber
2024 State
Rankings available to Premium Subscriber
Commitment
Best Of Stats
25.2
Hand Speed (max)
6/06/23
81.2
Bat Speed (max)
8/08/23
25
Rot. Acc (max)
3/27/21
80
Hard Hit %
2/26/22
99.2
Exit Velocity (max)
6/06/23
92.5
Exit Velocity (avg)
8/08/23
382
Distance (max)
2/25/23
78
Sweet Spot %
9/03/24
7.26
60
2/25/23
4.04
30-yd
8/08/23
1.77
10-yd
8/08/23
19.2
Run speed (max)
2/25/23
86
INF Velo
2/25/23
-
OF Velo
-
C Velo
-
Pop Time
Fastball
65
Velocity (max)
1/27/19
62 - 64
Velo Range
1/27/19
-
Spin Rate (avg)
Changeup
56 - 57
Velo Range
1/27/19
-
Spin Rate (avg)
Curveball
53 - 55
Velo Range
1/27/19
-
Spin Rate (avg)
Positional Tools
2024
2023
2022
2021
2020
2019
Infield Velocity
The athlete's maximum throwing velocity from an infield position in the given event year. Measured in miles per hour (MPH).
82.0
60 Yard Dash
The athlete's fastest 60-yard dash time in the given event year. Measured in seconds (s)
7.26
Infield Velocity
The athlete's maximum throwing velocity from an infield position in the given event year. Measured in miles per hour (MPH).
86.0
Power / Speed Score
A simple calculation that divides the athlete’s Exit Velocity Max by the athlete’s 60 Yard Dash time for the given event year. For example, 98 MPH / 7.00s = 14.00.
13.7
60 Yard Dash
The athlete's fastest 60-yard dash time in the given event year. Measured in seconds (s)
7.35
Infield Velocity
The athlete's maximum throwing velocity from an infield position in the given event year. Measured in miles per hour (MPH).
81.0
Power / Speed Score
A simple calculation that divides the athlete’s Exit Velocity Max by the athlete’s 60 Yard Dash time for the given event year. For example, 98 MPH / 7.00s = 14.00.
13.2
60 Yard Dash
The athlete's fastest 60-yard dash time in the given event year. Measured in seconds (s)
7.69
Infield Velocity
The athlete's maximum throwing velocity from an infield position in the given event year. Measured in miles per hour (MPH).
80.0
Power / Speed Score
A simple calculation that divides the athlete’s Exit Velocity Max by the athlete’s 60 Yard Dash time for the given event year. For example, 98 MPH / 7.00s = 14.00.
12.0
60 Yard Dash
The athlete's fastest 60-yard dash time in the given event year. Measured in seconds (s)
7.83
Home to First
The athlete's fastest home-to-first time in the given event year. Measured from bat-on-ball to foot-on-bag, in seconds (s).
4.9
Infield Velocity
The athlete's maximum throwing velocity from an infield position in the given event year. Measured in miles per hour (MPH).
76.0
Power / Speed Score
A simple calculation that divides the athlete’s Exit Velocity Max by the athlete’s 60 Yard Dash time for the given event year. For example, 98 MPH / 7.00s = 14.00.
10.9
60 Yard Dash
The athlete's fastest 60-yard dash time in the given event year. Measured in seconds (s)
8.76
Home to First
The athlete's fastest home-to-first time in the given event year. Measured from bat-on-ball to foot-on-bag, in seconds (s).
5.37
Infield Velocity
The athlete's maximum throwing velocity from an infield position in the given event year. Measured in miles per hour (MPH).
65.0
Power / Speed Score
A simple calculation that divides the athlete’s Exit Velocity Max by the athlete’s 60 Yard Dash time for the given event year. For example, 98 MPH / 7.00s = 14.00.
8.6
Hitting

2024
2023
2022
2021
2020
Exit Velocity Max
The highest exit velocity of any batted ball in the given event year. Measured in miles per hour (MPH).
97.0
Exit Velocity Avg
Average exit velocity of all batted balls in the given event year. Measured in miles per hour (MPH).
90.3
Distance Max
The highest flight distance of any batted ball in the given event year. Measured in feet (ft).
362
Distance Avg
Average flight distance of all batted balls in the given event year. Measured in feet (ft).
215
Launch Angle Avg
Average launch angle of all batted balls in the given event year. Measured in degrees.
12.8
Hard Hit %
Percentage of batted balls with exit velocities over 95 MPH in the given event year.
Sweet Spot %
Percentage of batted balls in the given event year with a launch angle between 8° and 32°.
Line Drive %
Percentage of batted balls with launch angles between 10 and 25 degrees in the given event year.
Fly Ball %
Percentage of batted balls with launch angles between 25 and 50 degrees in the given event year.
Ground Ball %
Percentage of batted balls with launch angles below 10 degrees in the given event year.
Exit Velocity Max
The highest exit velocity of any batted ball in the given event year. Measured in miles per hour (MPH).
99.2
Exit Velocity Avg
Average exit velocity of all batted balls in the given event year. Measured in miles per hour (MPH).
87.5
Distance Max
The highest flight distance of any batted ball in the given event year. Measured in feet (ft).
382
Distance Avg
Average flight distance of all batted balls in the given event year. Measured in feet (ft).
219
Launch Angle Avg
Average launch angle of all batted balls in the given event year. Measured in degrees.
18.8
Hard Hit %
Percentage of batted balls with exit velocities over 95 MPH in the given event year.
Sweet Spot %
Percentage of batted balls in the given event year with a launch angle between 8° and 32°.
Line Drive %
Percentage of batted balls with launch angles between 10 and 25 degrees in the given event year.
Fly Ball %
Percentage of batted balls with launch angles between 25 and 50 degrees in the given event year.
Ground Ball %
Percentage of batted balls with launch angles below 10 degrees in the given event year.
Exit Velocity Max
The highest exit velocity of any batted ball in the given event year. Measured in miles per hour (MPH).
96.8
Exit Velocity Avg
Average exit velocity of all batted balls in the given event year. Measured in miles per hour (MPH).
89.9
Distance Max
The highest flight distance of any batted ball in the given event year. Measured in feet (ft).
352
Distance Avg
Average flight distance of all batted balls in the given event year. Measured in feet (ft).
215
Launch Angle Avg
Average launch angle of all batted balls in the given event year. Measured in degrees.
18.5
Hard Hit %
Percentage of batted balls with exit velocities over 95 MPH in the given event year.
Sweet Spot %
Percentage of batted balls in the given event year with a launch angle between 8° and 32°.
Line Drive %
Percentage of batted balls with launch angles between 10 and 25 degrees in the given event year.
Fly Ball %
Percentage of batted balls with launch angles between 25 and 50 degrees in the given event year.
Ground Ball %
Percentage of batted balls with launch angles below 10 degrees in the given event year.
Exit Velocity Max
The highest exit velocity of any batted ball in the given event year. Measured in miles per hour (MPH).
92.6
Exit Velocity Avg
Average exit velocity of all batted balls in the given event year. Measured in miles per hour (MPH).
83.6
Distance Max
The highest flight distance of any batted ball in the given event year. Measured in feet (ft).
337
Distance Avg
Average flight distance of all batted balls in the given event year. Measured in feet (ft).
203
Launch Angle Avg
Average launch angle of all batted balls in the given event year. Measured in degrees.
17.6
Hard Hit %
Percentage of batted balls with exit velocities over 95 MPH in the given event year.
Sweet Spot %
Percentage of batted balls in the given event year with a launch angle between 8° and 32°.
Line Drive %
Percentage of batted balls with launch angles between 10 and 25 degrees in the given event year.
Fly Ball %
Percentage of batted balls with launch angles between 25 and 50 degrees in the given event year.
Ground Ball %
Percentage of batted balls with launch angles below 10 degrees in the given event year.
Exit Velocity Max
The highest exit velocity of any batted ball in the given event year. Measured in miles per hour (MPH).
85.7
Exit Velocity Avg
Average exit velocity of all batted balls in the given event year. Measured in miles per hour (MPH).
81.7
Distance Max
The highest flight distance of any batted ball in the given event year. Measured in feet (ft).
295
Distance Avg
Average flight distance of all batted balls in the given event year. Measured in feet (ft).
199
Launch Angle Avg
Average launch angle of all batted balls in the given event year. Measured in degrees.
18.8
Hard Hit %
Percentage of batted balls with exit velocities over 95 MPH in the given event year.
Sweet Spot %
Percentage of batted balls in the given event year with a launch angle between 8° and 32°.
Line Drive %
Percentage of batted balls with launch angles between 10 and 25 degrees in the given event year.
Fly Ball %
Percentage of batted balls with launch angles between 25 and 50 degrees in the given event year.
Ground Ball %
Percentage of batted balls with launch angles below 10 degrees in the given event year.
PBR IL: McHenry County College Scout Day
Sep 3, 2024
Trackman - Hitting
97.0
Exit Velocity (max)
90.3
Exit Velocity (avg)
215
Distance (avg)
362
Distance (max)
Hard Hit %
Sweet Spot %
Line Drive %
Fly Ball %
Ground Ball %
Illinois State Games (Invite-Only)
Aug 8, 2023
Trackman - Hitting
97.2
Exit Velocity (max)
92.5
Exit Velocity (avg)
202
Distance (avg)
338
Distance (max)
Hard Hit %
Sweet Spot %
Line Drive %
Fly Ball %
Ground Ball %
Top Tier Scout Day
Jun 6, 2023
Trackman - Hitting
99.2
Exit Velocity (max)
82.0
Exit Velocity (avg)
224
Distance (avg)
365
Distance (max)
Hard Hit %
Sweet Spot %
Line Drive %
Fly Ball %
Ground Ball %
Preseason All-State: Upperclass (Invite-Only)
Feb 25, 2023
Trackman - Hitting
98.1
Exit Velocity (max)
88.9
Exit Velocity (avg)
231
Distance (avg)
382
Distance (max)
Hard Hit %
Sweet Spot %
Line Drive %
Fly Ball %
Ground Ball %
Illinois State Games (Invite-Only)
Aug 9, 2022
Trackman - Hitting
91.9
Exit Velocity (max)
86.1
Exit Velocity (avg)
222
Distance (avg)
295
Distance (max)
Hard Hit %
Sweet Spot %
Line Drive %
Fly Ball %
Ground Ball %
Top Tier Scout Day
Jun 8, 2022
Trackman - Hitting
96.8
Exit Velocity (max)
91.1
Exit Velocity (avg)
199
Distance (avg)
352
Distance (max)
Hard Hit %
Sweet Spot %
Line Drive %
Fly Ball %
Ground Ball %
Preseason All-State: Underclass (Invite-Only)
Feb 26, 2022
Trackman - Hitting
95.9
Exit Velocity (max)
91.3
Exit Velocity (avg)
231
Distance (avg)
337
Distance (max)
Hard Hit %
Sweet Spot %
Line Drive %
Fly Ball %
Ground Ball %
Underclass Games (Invite Only)
Jul 20, 2021
Trackman - Hitting
92.6
Exit Velocity (max)
86.3
Exit Velocity (avg)
216
Distance (avg)
337
Distance (max)
Hard Hit %
Sweet Spot %
Line Drive %
Fly Ball %
Ground Ball %
Underclass Invitational (Invite Only)
Mar 27, 2021
Trackman - Hitting
92.3
Exit Velocity (max)
80.8
Exit Velocity (avg)
191
Distance (avg)
301
Distance (max)
Hard Hit %
Sweet Spot %
Line Drive %
Fly Ball %
Ground Ball %
2024 Top Prospect Games
Aug 22, 2020
Trackman - Hitting
85.7
Exit Velocity (max)
81.7
Exit Velocity (avg)
199
Distance (avg)
295
Distance (max)
Sweet Spot %
Line Drive %
Fly Ball %
Ground Ball %
Hitting

2024
2023
2022
2021
2020
Hand Speed Max
The highest Peak Hand Speed of any swing in the given event year.
21.9
Hand Speed Avg
The average Peak Hand Speed for all swings in the given event year.
21.0
Bat Speed Max
The highest Bat Speed of any swing in the given event year.
74.7
Bat Speed Avg
The average Bat Speed for all swings in the given event year.
71.7
Rotational Acceleration Max
The highest Rotational Acceleration of any swing in the given event year.
Rotational Acceleration Avg
The average Rotational Acceleration for all swings in the given event year.
On-Plane Efficiency Max
The highest On-Plane Efficiency of any swing in the given event year.
On-Plane Efficiency Avg
The average On-Plane Efficiency for all swings in the given event year.
Hand Speed Max
The highest Peak Hand Speed of any swing in the given event year.
25.2
Hand Speed Avg
The average Peak Hand Speed for all swings in the given event year.
20.3
Bat Speed Max
The highest Bat Speed of any swing in the given event year.
81.2
Bat Speed Avg
The average Bat Speed for all swings in the given event year.
74.0
Rotational Acceleration Max
The highest Rotational Acceleration of any swing in the given event year.
Rotational Acceleration Avg
The average Rotational Acceleration for all swings in the given event year.
On-Plane Efficiency Max
The highest On-Plane Efficiency of any swing in the given event year.
On-Plane Efficiency Avg
The average On-Plane Efficiency for all swings in the given event year.
Hand Speed Max
The highest Peak Hand Speed of any swing in the given event year.
22.8
Hand Speed Avg
The average Peak Hand Speed for all swings in the given event year.
20.6
Bat Speed Max
The highest Bat Speed of any swing in the given event year.
80.1
Bat Speed Avg
The average Bat Speed for all swings in the given event year.
71.1
Rotational Acceleration Max
The highest Rotational Acceleration of any swing in the given event year.
Rotational Acceleration Avg
The average Rotational Acceleration for all swings in the given event year.
On-Plane Efficiency Max
The highest On-Plane Efficiency of any swing in the given event year.
On-Plane Efficiency Avg
The average On-Plane Efficiency for all swings in the given event year.
Hand Speed Max
The highest Peak Hand Speed of any swing in the given event year.
23.0
Hand Speed Avg
The average Peak Hand Speed for all swings in the given event year.
21.5
Bat Speed Max
The highest Bat Speed of any swing in the given event year.
75.5
Bat Speed Avg
The average Bat Speed for all swings in the given event year.
71.8
Rotational Acceleration Max
The highest Rotational Acceleration of any swing in the given event year.
Rotational Acceleration Avg
The average Rotational Acceleration for all swings in the given event year.
On-Plane Efficiency Max
The highest On-Plane Efficiency of any swing in the given event year.
On-Plane Efficiency Avg
The average On-Plane Efficiency for all swings in the given event year.
Hand Speed Max
The highest Peak Hand Speed of any swing in the given event year.
20.5
Hand Speed Avg
The average Peak Hand Speed for all swings in the given event year.
19.5
Bat Speed Max
The highest Bat Speed of any swing in the given event year.
66.6
Bat Speed Avg
The average Bat Speed for all swings in the given event year.
63.6
Rotational Acceleration Max
The highest Rotational Acceleration of any swing in the given event year.
Rotational Acceleration Avg
The average Rotational Acceleration for all swings in the given event year.
On-Plane Efficiency Max
The highest On-Plane Efficiency of any swing in the given event year.
On-Plane Efficiency Avg
The average On-Plane Efficiency for all swings in the given event year.
PBR IL: McHenry County College Scout Day
Sep 3, 2024
Blast - Hitting
21.9
Hand Speed (max)
21.0
Hand Speed (avg)
74.7
Bat Speed (max)
71.7
Bat Speed (avg)
Rot. Acc (max)
Rot. Acc (avg)
On Plane Eff (avg)
MaxOnPlaneEfficiency
Illinois State Games (Invite-Only)
Aug 8, 2023
Blast - Hitting
21.4
Hand Speed (max)
18.9
Hand Speed (avg)
81.2
Bat Speed (max)
73.7
Bat Speed (avg)
Rot. Acc (max)
Rot. Acc (avg)
On Plane Eff (avg)
MaxOnPlaneEfficiency
Top Tier Scout Day
Jun 6, 2023
Blast - Hitting
25.2
Hand Speed (max)
22.3
Hand Speed (avg)
80.5
Bat Speed (max)
74.5
Bat Speed (avg)
Rot. Acc (max)
Rot. Acc (avg)
On Plane Eff (avg)
MaxOnPlaneEfficiency
Preseason All-State: Upperclass (Invite-Only)
Feb 25, 2023
Blast - Hitting
19.8
Hand Speed (max)
19.1
Hand Speed (avg)
76.7
Bat Speed (max)
73.6
Bat Speed (avg)
Rot. Acc (max)
Rot. Acc (avg)
On Plane Eff (avg)
MaxOnPlaneEfficiency
Illinois State Games (Invite-Only)
Aug 9, 2022
Blast - Hitting
21.2
Hand Speed (max)
19.9
Hand Speed (avg)
69.3
Bat Speed (max)
66.7
Bat Speed (avg)
Rot. Acc (max)
Rot. Acc (avg)
On Plane Eff (avg)
MaxOnPlaneEfficiency
Top Tier Scout Day
Jun 8, 2022
Blast - Hitting
22.8
Hand Speed (max)
20.9
Hand Speed (avg)
76.6
Bat Speed (max)
71.1
Bat Speed (avg)
Rot. Acc (max)
Rot. Acc (avg)
On Plane Eff (avg)
MaxOnPlaneEfficiency
Preseason All-State: Underclass (Invite-Only)
Feb 26, 2022
Blast - Hitting
22.2
Hand Speed (max)
21.1
Hand Speed (avg)
80.1
Bat Speed (max)
76.0
Bat Speed (avg)
Rot. Acc (max)
Rot. Acc (avg)
On Plane Eff (avg)
MaxOnPlaneEfficiency
Underclass Games (Invite Only)
Jul 20, 2021
Blast - Hitting
23.0
Hand Speed (max)
21.6
Hand Speed (avg)
75.5
Bat Speed (max)
73.7
Bat Speed (avg)
Rot. Acc (max)
Rot. Acc (avg)
On Plane Eff (avg)
MaxOnPlaneEfficiency
Underclass Invitational (Invite Only)
Mar 27, 2021
Blast - Hitting
22.7
Hand Speed (max)
21.4
Hand Speed (avg)
74.4
Bat Speed (max)
70.1
Bat Speed (avg)
Rot. Acc (max)
Rot. Acc (avg)
On Plane Eff (avg)
MaxOnPlaneEfficiency
2024 Top Prospect Games
Aug 22, 2020
Blast - Hitting
20.5
Hand Speed (max)
19.5
Hand Speed (avg)
66.6
Bat Speed (max)
63.6
Bat Speed (avg)
Rot. Acc (max)
Rot. Acc (avg)
On Plane Eff (avg)
MaxOnPlaneEfficiency
Pitching

Pitch Scores
Pitching Velos
2019
Fastball
Velocity Max
The maximum observed fastball velocity in the given event year. Measured in miles per hour (MPH).
65.0
Fastball
Velocity Avg
The average velocity for all pitches of this type in the given event year. Measured in miles per hour (MPH)
63.0
Curveball
Velocity Avg
The average velocity for all pitches of this type in the given event year. Measured in miles per hour (MPH)
54.0
Changeup
Velocity Avg
The average velocity for all pitches of this type in the given event year. Measured in miles per hour (MPH)
56.5
Game Performance

2024
2023
2022
10 Yard Dash
The athlete's fastest 0-10-yard split time in the given event year. Measured in seconds.
1.71
30 Yard Dash
The athlete's fastest 0-30-yard split time in the given event year. Measured in seconds.
3.92
60 Yard Dash
The athlete's fastest 0-60-yard time in the given event year. Measured in seconds.
7.11
Top Speed (MPH)
The athlete's fastest split time converted to miles per hour.
10 Yard Dash
The athlete's fastest 0-10-yard split time in the given event year. Measured in seconds.
1.77
30 Yard Dash
The athlete's fastest 0-30-yard split time in the given event year. Measured in seconds.
4.04
60 Yard Dash
The athlete's fastest 0-60-yard time in the given event year. Measured in seconds.
7.26
Top Speed (MPH)
The athlete's fastest split time converted to miles per hour.
RSi
The reactive strength index measurement of an athlete's explosiveness by comparing their jump height to the ground contact time in between their jumps. On a scale of 0-5.
Vertical Jump
A measure of any athlete's body strength and reach calculated from the flight time divided by the contact time.
Vertical Jump
A measure of any athlete's body strength and reach calculated from the flight time divided by the contact time.
Preseason All-State: Upperclass (Invite-Only)
Feb 25, 2023
Swift
1.82
10-yd
4.07
30-yd
7.26
60-yd
19.2
Run speed (max)
2.77
RSi (max)
2.77
RSi (avg)
1,713
Jump Power (max)
29.9
Jump Height (max)
29.2
Jump Height (avg)
Illinois State Games (Invite-Only)
Aug 9, 2022
Swift
1.78
10-yd
4.07
30-yd
7.35
60-yd
18.7
Run speed (max)
8.2
Run Speed (avg)
1,683
Jump Power (max)
29.3
Jump Height (max)
29.0
Jump Height (avg)
Visual Edge

2023
2022
2021
Edge Score
The highest Edge Score within the given year. Edge Score is a comprehensive score that takes the core-six visual skills into account, providing an assessment of an athlete’s overall visual ability.
75.17
Edge Score
The highest Edge Score within the given year. Edge Score is a comprehensive score that takes the core-six visual skills into account, providing an assessment of an athlete’s overall visual ability.
72.27
Edge Score
The highest Edge Score within the given year. Edge Score is a comprehensive score that takes the core-six visual skills into account, providing an assessment of an athlete’s overall visual ability.
66.47
Pitch Ai

Notes
News
- McHenry County Scout Day: Takeaways - Sep 18, 2024
- PBR IL: McHenry CC Scout Day Statistical & Data Analysis - Sep 6, 2024
- Recruiting Roundup: Week of 10/29 - Nov 3, 2023
- Illinois State Games: 2024 Infielder Analysis - Oct 20, 2023
- Top Tier Scout Day: Data Dive - Jun 14, 2023
- Preseason All-State Upperclass: Infield Analysis - May 10, 2023
- Preseason All State, Upperclass: Quick Hits - Mar 2, 2023
- Preseason All-State, Upperclass: Preview - Feb 24, 2023
- Illinois Class of 2024 Rankings: Risers and Newcomers - Aug 25, 2022
- Top Tier Scout Day: Takeaways - Aug 17, 2022
- Illinois State Games: Takeaways - Aug 15, 2022
- Illinois State Games: Roster Preview - Aug 4, 2022
- Preseason All-State Underclass: Infield Analysis - Jul 7, 2022
- Illinois Class of 2024 Rankings: On The Bubble - Jun 1, 2022
- Preseason All-State: Underclass TrackMan Files - Mar 3, 2022
- Preseason All-State: Underclass Blast Motion Board - Mar 3, 2022
- Preseason All-State: Underclass Statistical Analysis - Mar 2, 2022
- Preseason All-State: Underclass Quick Hits - Mar 1, 2022
- Best of 2021: Max Exit Velocity Leaders - Jan 11, 2022
- IL/WI Underclass Games: Infield Analysis - Dec 20, 2021
- Underclass Invitational: Infield Analysis - Jun 3, 2021
- Illinois 2024 Top Prospect Games: Infielder Analysis - Nov 5, 2020
- McHenry Future Prospects Showcase: Player Analysis - Mar 17, 2020
- Underclass Showcase: Infield Analysis - Nov 20, 2019
- Future Prospects Showcase: McHenry Analysis - Feb 27, 2019
Comments
Draft Reports
Contact
Premium Content Area
To unlock contact information, you need to purchase a ScoutPLUS subscription.
Purchase Subscription OR
Login
Physical
2023
Grip Strgth (LH)
Grip strength is a measure of a players bat control and ability to transfer power and speed during impact, measured in pounds of force generated; collected with elbow bent at 90 degrees.
Grip Strgth (RH)
Grip strength is a measure of a players bat control and ability to transfer power and speed during impact, measured in pounds of force generated; collected with elbow bent at 90 degrees.


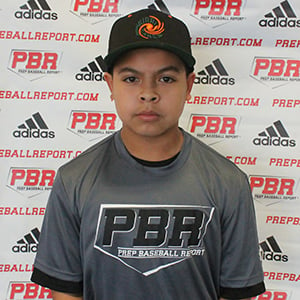
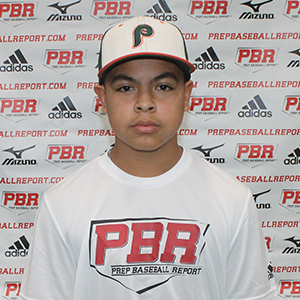
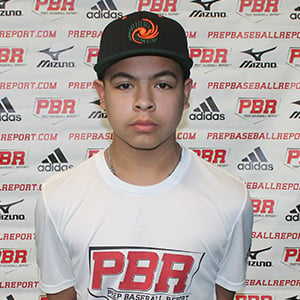
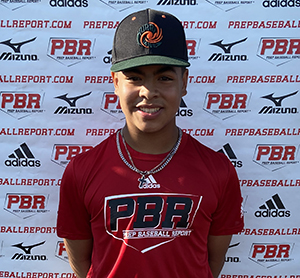









 Sign in to view rankings
Verbally committed to McHenry County JC.
Positional Profile: 2B/3B
Body: 5-10, 175-pounds. Compact frame with strength throughout.
Hit: RHH. Wide setup, leg kick trigger, gains ground. Controlled, aggressive swing, quick and slightly uphill path, all fields. 73.7 mph bat speed with 8 G’s of rotational acceleration.
Power: 97 max exit velocity, averaged 92.5 mph. 338’ max distance.
Arm: RH. INF - 85 mph. Compact, high 3/4 slot with acceleration out front.
Defense: Fluid, athletic actions, soft hands, clean/quick transfer, easy range with a quick first step.
Run: 7.27 runner in the 60.
Jackson Spring (St. Charles North), Cael Karczewski (Joliet West), Blake Crancer (Normal West), Will Potter (Downers Grove South), Bobby Kutt (Providence Catholic) and Jaden Obaldo (Crystal Lake Central) were a strong crop of middle infielders that should be able to stick up the middle moving forward and they all swing intriguing right-handed bats.
Positional Profile: 2B/3B
Body: 5-9, 175-pounds. Athletic build, lean, some strength in the lower-half.
Hit: RHH. Balanced stance, leg-kick trigger. Strong, compact swing, on time and ball is loud off the bat. Worked to the middle, pull-side of the field.
Power: 98 max exit velocity, averaged 88.9 mph. 382’ max distance.
Arm: RH. INF - 86 mph. Short, quick release, 3/4 slot with arm-speed, plays from different slots and on the move.
Defense: Soft hands with athletic actions, feel for the position, plays with tempo and confidence.
Run: 7.26 runner in the 60.
INF Jaden Obaldo (Crystal Lake Central, 2024) was an all-around winner offensively from the Illinois State Games, finding the barrel for a few extra-base hits across the event. Obaldo’s a physical right-handed hitter with compact strength attached to a 5-foot-9, 175-pound frame, finding the barrel with gap-to-gap feel.
Positional Profile: 2B/3B
Body: 5-9, 175-pounds. Compact build with advanced strength in the lower half.
Hits: RHH. Tall setup, bat tip load, high leg kick trigger, strides to target. Strong hands. Barrel stays in the zone, level to contact and swings with intent. Hard off the barrel at times.
Power: 92 max exit velocity, averaged 86.1 MPH. 295' max distance.
Arm: RH. INF-78 mph.Short arm action, ability to change slots.
Defense: Plays through the baseball, sure hands, funnels through release at times.
Run: 7.35 runner in the 60.
Vizual Edge: 66.98 Edge Score
Positional Profile: 2B/SS
Body: 5-8, 180-pounds. Compact build. Strong lower half.
Hit: RHH. Balanced base, squared, hands set shoulder high, high back elbow. Direct path to the baseball, consistent hard contact. Worked line-drives up the middle.
Power: 95.9 max exit velocity, averaged 91.3 mph. 337’ max distance.
Arm: RH. INF - 81 mph. Short arm action, high 3/4 slot. Some life out of the hand.
Defense: Clean two-handed gather out front. Funnels to the center. Controlled, methodical actions on the infield.
Run: 7.69 runner in the 60.
Oblado repeated barrel after barrel contact from the right side, generating a hard-hit rate of 80 percent, among the day’s best, and he averaged an exit speed of 91.3 mph, the second highest of the showcase.
Positional Profile: 2B/SS
Body: 5-8, 160-pounds.
Hit: RHH. Balanced setup, slightly open, leg-lift timing trigger into a short stride, hangs foot. Compact swing with a level path to the ball, loose arms with the ability to maintain balance throughout contact.
Power: 92.6 max exit velocity, averaged 86.3 mph. 337’ max distance.
Arm: RH. INF - 80 mph. Short 3/4 slot, able to change slots on the run.
Defense: Athletic infield actions, quick/clean transfer out of the glove, plays through the ball.
Run: 7.91 runner in the 60.
Positional Profile: 2B/SS
Body: 5-7, 140-pounds.
Hit: RHH. Narrow, open setup, leg kick, short stride. Aggressive swing, average bat speed of 70.1 MPH, path works efficiently uphill, pull-side tendencies.
Power: 92.35 max exit velocity, averaged 80.8 mph. 300’ max distance.
Arm: RH. INF - 78 mph. Long arm action, over-the-top arm slot.
Defense: Easy infield actions, active feet, steady hands, plays through baseball.
Run: 7.69 runner in the 60.
Positional Profile: 2B/SS
Body: 5-6, 140-pounds. Compact frame.
Hit: RHH. Balanced, narrow, slightly open setup, leg-kick timing trigger and maintains balance throughout. Athletic hands, feel for the barrel, level path and pull-side tendencies.
Power: 82 mph exit velocity from the tee. Max distance of 295' during BP, according to TrackMan.
Arm: RH. INF - 76 mph. Loose arm action, high 3/4 slot and throws play accurate across the infield.
Defense: Natural infield actions, gets around the baseball, sure-handed, plays through the baseball, clean release.
Run: 7.83 runner in the 60.
Positional Profile: 2B
Body: 5-foot-3, 125-pounds.
Defense: Soft hands, quick footwork, clean transfers and plays athletically.
Arm: RH. INF - 70 mph. Short, loose arm action, high 3/4 arm slot, throws played with carry.
Hit: RHH. Tall, open setup, leg-kick stride. Aggressive swings, fast hands, short bat path, fluid rhythm with a gap-to-gap approach.
Power: 77 mph exit velocity from the tee.
Run: 4.9 runner, home-to-first.
Positional Profile: 2B/SS
Body: 5-foot-3, 125-pounds. Compact build.
Hit: RHH. Athletic open set-up, smooth hand load, controlled leg kick into long stride, balanced finish. Direct bat path, slightly uphill plane, bat speed present, fluid rhythm, line drive contact.
Power: 75 mph exit velocity from the tee.
Arm: RH. INF - 62 mph. Short arm action, high 3/4 release point.
Defense: Plays through the baseball with tempo, clean exchange, active feet.
Run: 8.78 runner in the 60.
5-foot-1, 122-pound, right handed hitting infielder. Offensively, tall open stance, smooth pre-pitch load, short stride, high leg kick, good balance. Fluid rhythm, bat speed for age, uphill path with extension, gap-gap approach with pull tendencies. Exit velocity of 70 mph off the tee. Defensively, active feet with repeatable hand placement, clean exchange while playing through the ball. Throws from high ¾ slot, short arm action and topped at 61 mph across the diamond. Ran a 5.37 home to first.