Trackman Traits- Hitting: 2022 1B Matthew Williams (Warwick)
December 24, 2020
Welcome to the hitting side of Trackman Traits! In this series we will spotlight one player each week who stood out during this 2020 season and take a deeper dive into their numbers and take a look at some that really stand out. Since the implementation of the Trackman technology to our showcases this summer we have been fortunate enough to have seen a great deal of talent come through the system. Today, we will be taking a look at the number three first baseman in Pennsylvania's 2022 class, Matthew Williams.
Before we get started, we'll go over and define some of the terminology being used in the piece.
Exit Velocity- this one's pretty simple but this metric measures the speed of the ball off the bat, measured in miles per hour (mph).
Distance- another simple one, this metric measures how far the ball traveled or would travel if it was not obstructed, measured in feet.
Launch Angle- measures the vertical angle of the ball as it leaves the bat. Positive numbers represent balls traveling upward off of the bat and negative numbers mean the ball is traveling downward off of the bat.
Fly Ball %- Percentage of fly balls hit during a given set of batted ball events. Trackman defines a fly ball as any batted ball with a launch angle between 25 degrees and 49.9 degrees.
Line Drive%- Percentage of line drives hit during a given set of batted ball events. Trackman defines a line drive as any batted ball with a launch angle between 10 degrees and 24.9 degrees.
Hard Hit%- Percentage of batted balls with an exit velocity of 90 MPH or higher.
Bat Speed- The speed of the sweet spot of the bat at impact, measured in MPH. The sweet spot is measured 6 inches from the tip of the bat. - Blast Motion
Rotational Acceleration- A measure of how quickly the hitter gets from launch position to being on plane. This is measured in G-Force (g). - Blast Motion
TRACKMAN DATA ANALYSIS
For starters, Williams showed a peak exit velocity of 102.1 mph at the Pennsylvania State Games this summer. Any time we see a player get up over triple digits in BP, everybody notices a difference right away. The sound coming off his bat was something special, and he was consistently hitting the ball with authority, evident in his 94.43 average exit velocity and his 80% hard hit %.
Let's take a look at some of the leaderboards from the 2020 PA State Games to see where Williams ranked in a loaded event.
| Rank | Name | State | School | Class | Pos | Exit Velocity (max) |
| 1 | Rafe Perich | PA | Northwestern Lehigh | 2021 | SS | 103.1 mph |
| 2 | Michael Ciocco | PA | Peters Township | 2021 | 1B | 103.0 mph |
| 3 | Luke Zeisloft | PA | Central Columbia | 2022 | OF | 102.6 mph |
| 4 | Matt Tankred | PA | Southern Lehigh | 2022 | RHP | 102.2 mph |
| 5 | Justin Holmes | PA | Northwestern Lehigh | 2022 | OF | 102.1 mph |
| 6 | Matthew Williams | PA | Warwick | 2022 | 1B | 102.1 mph |
| 7 | Louie Kegerreis | PA | Franklin Regional | 2022 | 3B | 102.0 mph |
| 8 | Andrew Kohl | PA | Central Bucks West | 2021 | OF | 102.0 mph |
| 9 | Jimmy Kirk | PA | Malvern Prep | 2021 | 1B | 101.8 mph |
| 10 | Tyler Switalski | PA | Waynesburg Central | 2021 | LHP | 101.7 mph |
| Rank | Name | State | School | Class | Pos | Exit Velocity (avg) |
| 1 | Andrew Kohl | PA | Central Bucks West | 2021 | OF | 97.5 mph |
| 2 | Louie Kegerreis | PA | Franklin Regional | 2022 | 3B | 96.5 mph |
| 3 | Michael Ciocco | PA | Peters Township | 2021 | 1B | 96.1 mph |
| 4 | Matthew Williams | PA | Warwick | 2022 | 1B | 94.4 mph |
| 5 | Matt Tankred | PA | Southern Lehigh | 2022 | RHP | 94.1 mph |
| 6 | Jack Lincoln | PA | Avon Grove | 2021 | 3B | 93.4 mph |
| 7 | Jack Malec | PA | Cathedral Prep | 2021 | 1B | 93.3 mph |
| 8 | Tyler Switalski | PA | Waynesburg Central | 2021 | LHP | 93.3 mph |
| 9 | Daniel Kanagy | PA | East Juniata | 2021 | RHP | 93.3 mph |
| 10 | Connor Booth | PA | Oxford Area | 2022 | C | 92.9 mph |
| Rank | Name | State | School | Class | Pos | Distance (max) |
| 1 | Andrew Kohl | PA | Central Bucks West | 2021 | OF | 409 ft |
| 2 | Michael Ciocco | PA | Peters Township | 2021 | 1B | 403 ft |
| 3 | Matthew Williams | PA | Warwick | 2022 | 1B | 388 ft |
| 4 | Drew Ripepi | PA | Peters Township | 2022 | 3B | 388 ft |
| 5 | Kyle Musser | PA | Manheim Township | 2021 | OF | 388 ft |
| 6 | Jack Malec | PA | Cathedral Prep | 2021 | 1B | 383 ft |
| 7 | Rafe Perich | PA | Northwestern Lehigh | 2021 | SS | 381 ft |
| 8 | Jack Lincoln | PA | Avon Grove | 2021 | 3B | 380 ft |
| 9 | JD Greeley | PA | Pocono Mountain West | 2021 | 3B | 379 ft |
| 10 | Chris Juchno | PA | McDowell | 2021 | OF | 379 ft |
| Rank | Name | State | School | Class | Pos | Distance (avg) |
| 1 | Michael Ciocco | PA | Peters Township | 2021 | 1B | 333 ft |
| 2 | Andrew Kingsbury | PA | Phoenixville | 2022 | RHP | 328 ft |
| 3 | Tanner Singh | PA | Pine-Richland | 2021 | OF | 322 ft |
| 4 | Maddix Dalena | PA | Montoursville | 2022 | 1B | 314 ft |
| 5 | Rafe Perich | PA | Northwestern Lehigh | 2021 | SS | 313 ft |
| 6 | Colton Cornell | PA | Forest Hills | 2022 | 3B | 312 ft |
| 7 | Kyle Musser | PA | Manheim Township | 2021 | OF | 309 ft |
| 8 | Drew Ripepi | PA | Peters Township | 2022 | 3B | 306 ft |
| 9 | Colin Marinpetro | PA | West Allegheny | 2022 | 1B | 303 ft |
| 10 | Matthew Williams | PA | Warwick | 2022 | 1B | 302 ft |
Showing in the top 10 in these categories among the group of bats present in DuBois for the State Games is no small feat. Along with a high exit velocity, Williams also showed the ability to hit the ball a long way with his longest ball being hit 388 ft. His average distance during his round was 302 ft, showing that he has the ability to pound the ball and at least find some gaps. He did this by hitting a steady diet of fly balls and line drives, with 60% fly balls and 30% line drives.
When a player hits the ball over 100 mph, their chance to succeed is usually pretty high. Whether you hit the ball on the ground, on a line, or in the air, balls batted over 100 mph have a way of finding holes. To take a look at the relationship between exit velocity and launch angle, we'll use one of my favorite tools, the Statcast Exit Velocity & Launch Angle Field Breakdown. This tool allows you to input an exit velocity and launch angle and it will generate a plot of all the times that exact combination happened in an MLB game and show the results of all of those specific batted ball events. To show the effect on balls hit over 100 mph, we'll look at balls hit at 102 mph, Williams' peak exit velocity and balls hit at 94 mph, Williams average exit velocity. For a launch angle, we'll go with 20 degrees, just below what Trackman considers a fly ball, but still a high line drive, because of Williams' distribution of fly balls and line drives during his round.
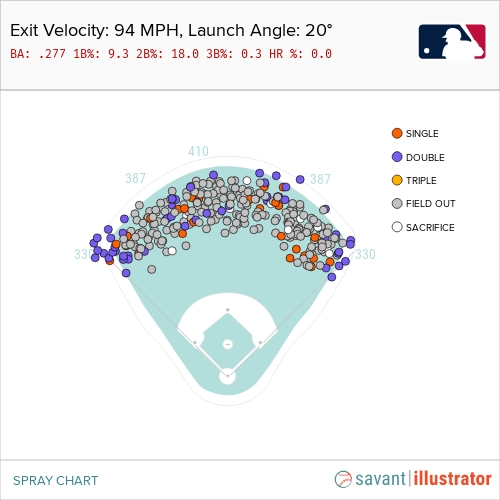
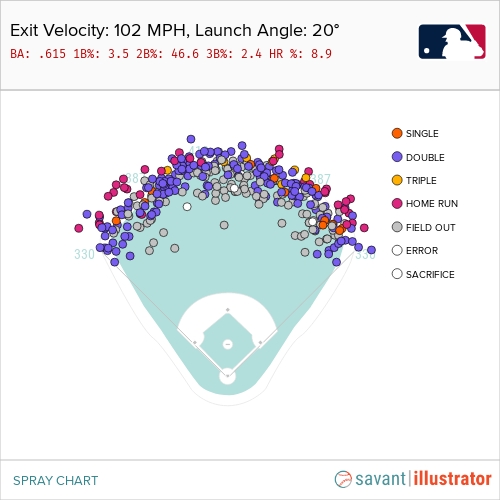
As you can see, the 8 mph in exit velocity makes a huge difference. Balls hit at 94 mph with a 20 degree launch angle were good for a .277 batting average and were good for extra-bases just 18.3% of the time and have never resulted in a home run. When you get above that 100 mph barrier in exit velocity and jump to 102 mph like Williams did, the results become a lot better. With that 102 mph exit velocity and a 20 degree launch angle, that batting average jumped all the way to .615 with extra-bases coming 57.9 % of the time. The percentage of home runs also jumps from 0 to 8.9% when hit at 102 mph. Damage can be done when you hit the ball under 100 mph, but getting over triple digits seems to unlock a different level.
Williams should have success at any level if he is able to continue to hit the ball as hard as he can. 102.1 mph is impressive, but not even Williams' highest of the summer. He registered a 104 mph exit velocity at the Futures Games this summer. For fun, we'll look at what those added two mph would do combined with a 20 degree launch angle.
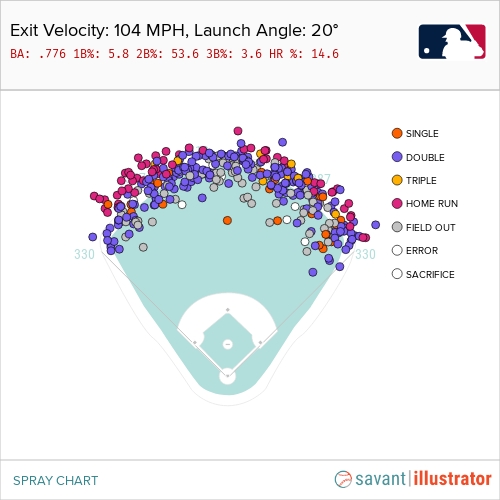
Unsurprisingly, the results get even better. No matter your approach at the plate, whether you like to lift the ball in the air or like to pound line drives, hitting the ball harder is a good way to see better results. Let's get a deeper look into why Williams is able to hit the ball so hard.
BLAST CONNECTION
Trackman does a great job showing the outcomes of players swings and their batted ball events. Its data is results based, the best numbers come when you get off your best swing and make your best contact. Blast Motion technology, also implemented at the same time this summer as the Trackman, tracks the swing data of a player and can shine a light into what a player does well in their swing. When paired with Trackman data, it can paint a more complete picture of a hitter and help explain why a player is able to hit the ball harder, farther, and more consistently than others.
Two Blast Motion metrics that I like to look at are bat speed and hand speed. These two metrics are easy to confuse, but bat speed looks at the speed of the barrel and hand speed looks at the speed of the handle and are both measured at their peak speed during the swing. Higher bat speed can be achieved through a number of different ways, and Williams' long levers certainly help him generate some extra bat speed. Aside from just a player's physical profile, other Blast metrics such as hand speed can point to why some players have a higher bat speed.
Unsurprisingly, these were two metrics that Williams was above average in. He showcased a peak bat speed of 78.5 mph, tops at the event. Following his trend of consistent big numbers, his average bat speed was 76.64 mph. He was remarkably consistent in swinging it very hard. His peak and average numbers both showcase his quick bat and that should help project well against increased velocity.
Williams showed very quick hands, a reason why that bat speed is as high as it is. He peaked at a 24.6 mph hand speed and averaged a 22.81 mph hand speed, both advanced numbers pointing to a reason why he was able to swing it so well. In a game setting, higher hand speed and bat speed will allow you that extra split second to see the ball out of the pitchers hand and make later decision while still being able to catch up to increased velocity.
CONCLUSION
When a player with the stature that Matt Williams has also shows the advanced bat speed and hand speed like he does, it's no wonder he was able to punish baseballs as frequently as he did. He did his best to stand out amongst a loaded group of bats at the 2020 PA State Games and it earned him a trip to the Futures Games, where he was able to put up even higher numbers. We will certainly be keeping an eye on the big fella during the upcoming 2021 season.

UPCOMING EVENTS
| SHOWCASE | STATE | DATE | LOCATION |
| 2021 Preseason All-State - South/Central | PA | 02/06 | Iron Horse Sports Complex |
| Super 60 Pro Showcase | NATIONAL | 02/07 | MOSH Performance Center |
| 2021 Preseason All-State - Pittsburgh (3PM Session) | PA | 02/07 | All American Fieldhouse |
| 2021 Preseason All-State - Pittsburgh (9AM Session) | PA | 02/07 | All American Fieldhouse |
| 2021 Northeast ProCase (2021 Grads Only) | PA | 02/13 | Liberty Sports Arena |
| 2021 Preseason All-State - Erie | PA | 02/13 | Erie Premier Sports |
| 2021 Preseason All-State - North/Central | PA | 02/14 | Liberty Sports Arena |
| 2021 Preseason All-State - East (11AM Session) | PA | 02/27 | Keystone State Baseball Academy |
| 2021 Preseason All-State East (3PM Session) | PA | 02/27 | Keystone State Baseball Academy |
| 2021 JR PA State Games Trials - Central | PA | 03/06 | Liberty Sports Arena |
| 2021 JR PA State Games Trials - East | PA | 03/14 | Keystone State Baseball Academy |
| 2021 JR PA State Games Trials - West | PA | 03/14 | All American Fieldhouse |
Overview