CLASS OF 2025
C
3B
Enzo
Infelise
Providence Catholic (HS) • IL
 6' 2" • 229LBS
R/R • 18yr
Travel Team: Cangelosi sparks Jupiter team
R/R • 18yr
Travel Team: Cangelosi sparks Jupiter team
Rankings
2025 National
Rankings available to Premium Subscriber
2025 State
Rankings available to Premium Subscriber
Commitment
Best Of Stats
24.7
Hand Speed (max)
8/06/24
82.1
Bat Speed (max)
8/06/24
24
Rot. Acc (max)
2/21/22
100
Hard Hit %
2/24/24
102.4
Exit Velocity (max)
8/06/24
98.4
Exit Velocity (avg)
2/24/24
385
Distance (max)
2/25/23
86
Sweet Spot %
2/25/23
7.43
60
2/24/24
4.1
30-yd
8/06/24
1.74
10-yd
8/06/24
18
Run speed (max)
8/06/24
90
INF Velo
2/24/24
-
OF Velo
83
C Velo
2/24/24
1.85 - 1.94
Pop Time
8/09/22
Fastball
90
Velocity (max)
3/11/24
87 - 89
Velo Range
3/11/24
2075
Spin Rate (avg)
2/21/22
Changeup
78 - 81
Velo Range
8/09/22
1910
Spin Rate (avg)
2/26/22
Curveball
70 - 72
Velo Range
3/11/24
2305
Spin Rate (avg)
2/26/22
Positional Tools
2024
2023
2022
2021
2020
2019
60 Yard Dash
The athlete's fastest 60-yard dash time in the given event year. Measured in seconds (s)
7.43
Pop Time
The athlete's fastest pop time in the given event year. Measured from glove to glove, in seconds (s).
1.86 - 1.95
Catcher Velocity
The athlete's maximum throwing velocity from the catcher position in the given event year. Measured in miles per hour (MPH).
83.0
Infield Velocity
The athlete's maximum throwing velocity from an infield position in the given event year. Measured in miles per hour (MPH).
90.0
Power / Speed Score
A simple calculation that divides the athlete’s Exit Velocity Max by the athlete’s 60 Yard Dash time for the given event year. For example, 98 MPH / 7.00s = 14.00.
13.8
60 Yard Dash
The athlete's fastest 60-yard dash time in the given event year. Measured in seconds (s)
7.74
Pop Time
The athlete's fastest pop time in the given event year. Measured from glove to glove, in seconds (s).
1.90 - 2.02
Catcher Velocity
The athlete's maximum throwing velocity from the catcher position in the given event year. Measured in miles per hour (MPH).
82.0
Infield Velocity
The athlete's maximum throwing velocity from an infield position in the given event year. Measured in miles per hour (MPH).
90.0
Power / Speed Score
A simple calculation that divides the athlete’s Exit Velocity Max by the athlete’s 60 Yard Dash time for the given event year. For example, 98 MPH / 7.00s = 14.00.
13.1
60 Yard Dash
The athlete's fastest 60-yard dash time in the given event year. Measured in seconds (s)
7.87
Pop Time
The athlete's fastest pop time in the given event year. Measured from glove to glove, in seconds (s).
1.85 - 2.12
Catcher Velocity
The athlete's maximum throwing velocity from the catcher position in the given event year. Measured in miles per hour (MPH).
79.0
Infield Velocity
The athlete's maximum throwing velocity from an infield position in the given event year. Measured in miles per hour (MPH).
87.0
Power / Speed Score
A simple calculation that divides the athlete’s Exit Velocity Max by the athlete’s 60 Yard Dash time for the given event year. For example, 98 MPH / 7.00s = 14.00.
12.5
60 Yard Dash
The athlete's fastest 60-yard dash time in the given event year. Measured in seconds (s)
8.50
Pop Time
The athlete's fastest pop time in the given event year. Measured from glove to glove, in seconds (s).
2.00 - 2.01
Catcher Velocity
The athlete's maximum throwing velocity from the catcher position in the given event year. Measured in miles per hour (MPH).
74.0
Infield Velocity
The athlete's maximum throwing velocity from an infield position in the given event year. Measured in miles per hour (MPH).
82.0
Power / Speed Score
A simple calculation that divides the athlete’s Exit Velocity Max by the athlete’s 60 Yard Dash time for the given event year. For example, 98 MPH / 7.00s = 14.00.
10.7
Infield Velocity
The athlete's maximum throwing velocity from an infield position in the given event year. Measured in miles per hour (MPH).
66.0
Pop Time
The athlete's fastest pop time in the given event year. Measured from glove to glove, in seconds (s).
2.58 - 2.72
Catcher Velocity
The athlete's maximum throwing velocity from the catcher position in the given event year. Measured in miles per hour (MPH).
56.0
Illinois State Games (Invite-Only)
Aug 6, 2024
Position
7.51
60-yard
1.87 - 1.95
Pop Time
88
INF Velo
81
C Velo
102
Exit Velo
Power Speed Score
Preseason All-State: Upperclass (Invite-Only)
Feb 24, 2024
Position
7.43
60-yard
1.86 - 1.91
Pop Time
90
INF Velo
83
C Velo
101
Exit Velo
Power Speed Score
Preseason All-State: Underclass (Invite-Only)
Feb 25, 2023
Position
7.74
60-yard
1.90 - 2.02
Pop Time
90
INF Velo
82
C Velo
101
Exit Velo
Power Speed Score
Preseason All-State: Underclass (Invite-Only)
Feb 26, 2022
Position
8.04
60-yard
2.02 - 2.12
Pop Time
84
INF Velo
74
C Velo
97
Exit Velo
Power Speed Score
Underclass Showcase
Oct 17, 2021
Position
8.50
60-yard
2.00 - 2.01
Pop Time
81
INF Velo
74
C Velo
91
Exit Velo
Power Speed Score
Hitting

2024
2023
2022
2021
Exit Velocity Max
The highest exit velocity of any batted ball in the given event year. Measured in miles per hour (MPH).
102.4
Exit Velocity Avg
Average exit velocity of all batted balls in the given event year. Measured in miles per hour (MPH).
96.9
Distance Max
The highest flight distance of any batted ball in the given event year. Measured in feet (ft).
356
Distance Avg
Average flight distance of all batted balls in the given event year. Measured in feet (ft).
173
Launch Angle Avg
Average launch angle of all batted balls in the given event year. Measured in degrees.
9.9
Hard Hit %
Percentage of batted balls with exit velocities over 95 MPH in the given event year.
Sweet Spot %
Percentage of batted balls in the given event year with a launch angle between 8° and 32°.
Line Drive %
Percentage of batted balls with launch angles between 10 and 25 degrees in the given event year.
Fly Ball %
Percentage of batted balls with launch angles between 25 and 50 degrees in the given event year.
Ground Ball %
Percentage of batted balls with launch angles below 10 degrees in the given event year.
Exit Velocity Max
The highest exit velocity of any batted ball in the given event year. Measured in miles per hour (MPH).
101.5
Exit Velocity Avg
Average exit velocity of all batted balls in the given event year. Measured in miles per hour (MPH).
91.6
Distance Max
The highest flight distance of any batted ball in the given event year. Measured in feet (ft).
385
Distance Avg
Average flight distance of all batted balls in the given event year. Measured in feet (ft).
258
Launch Angle Avg
Average launch angle of all batted balls in the given event year. Measured in degrees.
17.6
Hard Hit %
Percentage of batted balls with exit velocities over 95 MPH in the given event year.
Sweet Spot %
Percentage of batted balls in the given event year with a launch angle between 8° and 32°.
Line Drive %
Percentage of batted balls with launch angles between 10 and 25 degrees in the given event year.
Fly Ball %
Percentage of batted balls with launch angles between 25 and 50 degrees in the given event year.
Ground Ball %
Percentage of batted balls with launch angles below 10 degrees in the given event year.
Exit Velocity Max
The highest exit velocity of any batted ball in the given event year. Measured in miles per hour (MPH).
98.3
Exit Velocity Avg
Average exit velocity of all batted balls in the given event year. Measured in miles per hour (MPH).
85.0
Distance Max
The highest flight distance of any batted ball in the given event year. Measured in feet (ft).
346
Distance Avg
Average flight distance of all batted balls in the given event year. Measured in feet (ft).
250
Launch Angle Avg
Average launch angle of all batted balls in the given event year. Measured in degrees.
26.7
Hard Hit %
Percentage of batted balls with exit velocities over 95 MPH in the given event year.
Sweet Spot %
Percentage of batted balls in the given event year with a launch angle between 8° and 32°.
Line Drive %
Percentage of batted balls with launch angles between 10 and 25 degrees in the given event year.
Fly Ball %
Percentage of batted balls with launch angles between 25 and 50 degrees in the given event year.
Ground Ball %
Percentage of batted balls with launch angles below 10 degrees in the given event year.
Exit Velocity Max
The highest exit velocity of any batted ball in the given event year. Measured in miles per hour (MPH).
90.9
Exit Velocity Avg
Average exit velocity of all batted balls in the given event year. Measured in miles per hour (MPH).
86.1
Distance Max
The highest flight distance of any batted ball in the given event year. Measured in feet (ft).
341
Distance Avg
Average flight distance of all batted balls in the given event year. Measured in feet (ft).
260
Launch Angle Avg
Average launch angle of all batted balls in the given event year. Measured in degrees.
24.6
Hard Hit %
Percentage of batted balls with exit velocities over 95 MPH in the given event year.
Sweet Spot %
Percentage of batted balls in the given event year with a launch angle between 8° and 32°.
Line Drive %
Percentage of batted balls with launch angles between 10 and 25 degrees in the given event year.
Fly Ball %
Percentage of batted balls with launch angles between 25 and 50 degrees in the given event year.
Ground Ball %
Percentage of batted balls with launch angles below 10 degrees in the given event year.
Illinois State Games (Invite-Only)
Aug 6, 2024
Trackman - Hitting
102.4
Exit Velocity (max)
94.4
Exit Velocity (avg)
212
Distance (avg)
356
Distance (max)
Hard Hit %
Barrel %
Sweet Spot %
Line Drive %
Fly Ball %
Ground Ball %
Preseason All-State: Upperclass (Invite-Only)
Feb 24, 2024
Trackman - Hitting
101.4
Exit Velocity (max)
98.4
Exit Velocity (avg)
149
Distance (avg)
313
Distance (max)
Hard Hit %
Sweet Spot %
Line Drive %
Ground Ball %
Preseason All-State: Underclass (Invite-Only)
Feb 25, 2023
Trackman - Hitting
101.5
Exit Velocity (max)
91.6
Exit Velocity (avg)
258
Distance (avg)
385
Distance (max)
Hard Hit %
Barrel %
Sweet Spot %
Line Drive %
Fly Ball %
Ground Ball %
Illinois State Games (Invite-Only)
Aug 9, 2022
Trackman - Hitting
95.4
Exit Velocity (max)
82.3
Exit Velocity (avg)
233
Distance (avg)
312
Distance (max)
Hard Hit %
Sweet Spot %
Line Drive %
Fly Ball %
Ground Ball %
2022 PBR Future Games
Jul 27, 2022
Trackman - Hitting
94.7
Exit Velocity (max)
91.0
Exit Velocity (avg)
237
Distance (avg)
336
Distance (max)
Hard Hit %
Sweet Spot %
Line Drive %
Fly Ball %
Ground Ball %
Preseason All-State: Underclass (Invite-Only)
Feb 26, 2022
Trackman - Hitting
97.4
Exit Velocity (max)
84.1
Exit Velocity (avg)
259
Distance (avg)
346
Distance (max)
Hard Hit %
Sweet Spot %
Line Drive %
Fly Ball %
Ground Ball %
Lockport Preseason ID
Feb 21, 2022
Trackman - Hitting
98.3
Exit Velocity (max)
89.4
Exit Velocity (avg)
262
Distance (avg)
325
Distance (max)
Hard Hit %
Sweet Spot %
Line Drive %
Fly Ball %
Ground Ball %
Underclass Showcase
Oct 17, 2021
Trackman - Hitting
90.9
Exit Velocity (max)
88.4
Exit Velocity (avg)
289
Distance (avg)
341
Distance (max)
Hard Hit %
Sweet Spot %
Line Drive %
Fly Ball %
Junior Future Games Workout - IL/WI
Jul 28, 2021
Trackman - Hitting
89.9
Exit Velocity (max)
83.1
Exit Velocity (avg)
222
Distance (avg)
336
Distance (max)
Sweet Spot %
Line Drive %
Fly Ball %
Ground Ball %
Hitting

2024
2023
2022
2021
Hand Speed Max
The highest Peak Hand Speed of any swing in the given event year.
24.7
Hand Speed Avg
The average Peak Hand Speed for all swings in the given event year.
22.0
Bat Speed Max
The highest Bat Speed of any swing in the given event year.
82.1
Bat Speed Avg
The average Bat Speed for all swings in the given event year.
74.4
Rotational Acceleration Max
The highest Rotational Acceleration of any swing in the given event year.
Rotational Acceleration Avg
The average Rotational Acceleration for all swings in the given event year.
On-Plane Efficiency Max
The highest On-Plane Efficiency of any swing in the given event year.
On-Plane Efficiency Avg
The average On-Plane Efficiency for all swings in the given event year.
Hand Speed Max
The highest Peak Hand Speed of any swing in the given event year.
21.2
Hand Speed Avg
The average Peak Hand Speed for all swings in the given event year.
19.3
Bat Speed Max
The highest Bat Speed of any swing in the given event year.
78.5
Bat Speed Avg
The average Bat Speed for all swings in the given event year.
73.2
Rotational Acceleration Max
The highest Rotational Acceleration of any swing in the given event year.
Rotational Acceleration Avg
The average Rotational Acceleration for all swings in the given event year.
On-Plane Efficiency Max
The highest On-Plane Efficiency of any swing in the given event year.
On-Plane Efficiency Avg
The average On-Plane Efficiency for all swings in the given event year.
Hand Speed Max
The highest Peak Hand Speed of any swing in the given event year.
23.4
Hand Speed Avg
The average Peak Hand Speed for all swings in the given event year.
21.8
Bat Speed Max
The highest Bat Speed of any swing in the given event year.
79.4
Bat Speed Avg
The average Bat Speed for all swings in the given event year.
68.5
Rotational Acceleration Max
The highest Rotational Acceleration of any swing in the given event year.
Rotational Acceleration Avg
The average Rotational Acceleration for all swings in the given event year.
On-Plane Efficiency Max
The highest On-Plane Efficiency of any swing in the given event year.
On-Plane Efficiency Avg
The average On-Plane Efficiency for all swings in the given event year.
Hand Speed Max
The highest Peak Hand Speed of any swing in the given event year.
20.6
Hand Speed Avg
The average Peak Hand Speed for all swings in the given event year.
19.4
Bat Speed Max
The highest Bat Speed of any swing in the given event year.
68.5
Bat Speed Avg
The average Bat Speed for all swings in the given event year.
66.3
Rotational Acceleration Max
The highest Rotational Acceleration of any swing in the given event year.
Rotational Acceleration Avg
The average Rotational Acceleration for all swings in the given event year.
On-Plane Efficiency Max
The highest On-Plane Efficiency of any swing in the given event year.
On-Plane Efficiency Avg
The average On-Plane Efficiency for all swings in the given event year.
Illinois State Games (Invite-Only)
Aug 6, 2024
Blast - Hitting
24.7
Hand Speed (max)
22.8
Hand Speed (avg)
82.1
Bat Speed (max)
74.3
Bat Speed (avg)
Rot. Acc (max)
Rot. Acc (avg)
On Plane Eff (avg)
MaxOnPlaneEfficiency
Preseason All-State: Upperclass (Invite-Only)
Feb 24, 2024
Blast - Hitting
21.7
Hand Speed (max)
20.8
Hand Speed (avg)
76.2
Bat Speed (max)
74.7
Bat Speed (avg)
Rot. Acc (max)
Rot. Acc (avg)
On Plane Eff (avg)
MaxOnPlaneEfficiency
Preseason All-State: Underclass (Invite-Only)
Feb 25, 2023
Blast - Hitting
21.2
Hand Speed (max)
19.3
Hand Speed (avg)
78.5
Bat Speed (max)
73.2
Bat Speed (avg)
Rot. Acc (max)
Rot. Acc (avg)
On Plane Eff (avg)
MaxOnPlaneEfficiency
Illinois State Games (Invite-Only)
Aug 9, 2022
Blast - Hitting
23.4
Hand Speed (max)
22.1
Hand Speed (avg)
73.2
Bat Speed (max)
69.2
Bat Speed (avg)
Rot. Acc (max)
Rot. Acc (avg)
On Plane Eff (avg)
MaxOnPlaneEfficiency
Preseason All-State: Underclass (Invite-Only)
Feb 26, 2022
Blast - Hitting
22.9
Hand Speed (max)
21.6
Hand Speed (avg)
79.4
Bat Speed (max)
67.8
Bat Speed (avg)
Rot. Acc (max)
Rot. Acc (avg)
On Plane Eff (avg)
MaxOnPlaneEfficiency
Lockport Preseason ID
Feb 21, 2022
Blast - Hitting
23.1
Hand Speed (max)
21.7
Hand Speed (avg)
72.2
Bat Speed (max)
68.5
Bat Speed (avg)
Rot. Acc (max)
Rot. Acc (avg)
On Plane Eff (avg)
MaxOnPlaneEfficiency
Underclass Showcase
Oct 17, 2021
Blast - Hitting
20.6
Hand Speed (max)
19.4
Hand Speed (avg)
68.5
Bat Speed (max)
66.3
Bat Speed (avg)
Rot. Acc (max)
Rot. Acc (avg)
On Plane Eff (avg)
MaxOnPlaneEfficiency
Pitching

2022
2021
Fastball
Velocity Max
The maximum observed fastball velocity in the given event year. Measured in miles per hour (MPH).
83.8
Fastball
Velocity Avg
The average velocity for all pitches of this type in the given event year. Measured in miles per hour (MPH).
83.0
Fastball
Spin Rate Avg
The average rate of spin for all pitches of this type in the given event year. Measured in rotations per minute (RPM).
2049
Fastball
Spin Score Avg
The average Bauer Units value of all fastballs in the given event year. Bauer Units are calculated for each pitch by dividing Spin Rate by Velocity.
24.7
Fastball
Total Movement Avg
The average total non-gravity movement for all pitches of this type in the given event year. Measured in inches (in).
Curveball
Velocity Avg
The average velocity for all pitches of this type in the given event year. Measured in miles per hour (MPH).
67.2
Curveball
Spin Rate Avg
The average rate of spin for all pitches of this type in the given event year. Measured in rotations per minute (RPM).
2288
Curveball
Total Movement Avg
The average total non-gravity movement for all pitches of this type in the given event year. Measured in inches (in).
Changeup
Velocity Avg
The average velocity for all pitches of this type in the given event year. Measured in miles per hour (MPH).
76.2
Changeup
Spin Rate Avg
The average rate of spin for all pitches of this type in the given event year. Measured in rotations per minute (RPM).
1898
Changeup
Total Movement Avg
The average total non-gravity movement for all pitches of this type in the given event year. Measured in inches (in).
Fastball
Velocity Max
The maximum observed fastball velocity in the given event year. Measured in miles per hour (MPH).
79.2
Fastball
Velocity Avg
The average velocity for all pitches of this type in the given event year. Measured in miles per hour (MPH).
78.7
Fastball
Spin Rate Avg
The average rate of spin for all pitches of this type in the given event year. Measured in rotations per minute (RPM).
1858
Fastball
Spin Score Avg
The average Bauer Units value of all fastballs in the given event year. Bauer Units are calculated for each pitch by dividing Spin Rate by Velocity.
23.6
Fastball
Total Movement Avg
The average total non-gravity movement for all pitches of this type in the given event year. Measured in inches (in).
Curveball
Velocity Avg
The average velocity for all pitches of this type in the given event year. Measured in miles per hour (MPH).
63.8
Curveball
Spin Rate Avg
The average rate of spin for all pitches of this type in the given event year. Measured in rotations per minute (RPM).
2083
Curveball
Total Movement Avg
The average total non-gravity movement for all pitches of this type in the given event year. Measured in inches (in).
Changeup
Velocity Avg
The average velocity for all pitches of this type in the given event year. Measured in miles per hour (MPH).
74.5
Changeup
Spin Rate Avg
The average rate of spin for all pitches of this type in the given event year. Measured in rotations per minute (RPM).
1820
Changeup
Total Movement Avg
The average total non-gravity movement for all pitches of this type in the given event year. Measured in inches (in).
Illinois State Games (Invite-Only)
Aug 9, 2022
Trackman - Fastball
86.7
Velocity (max)
84.1 - 85.8
Velo Range
82.7
Eff Velocity (avg)
2,289
Spin Rate (max)
2,196
Spin Rate (avg)
IVB (max)
IVB (avg)
HM (max)
HM (avg)
Extension (avg)
Release Ht (avg)
Spin Score (max)
Zone %
Trackman - Curveball
70.9
Velocity (max)
68.4 - 70.4
Velo Range
67.3
Eff Velocity (avg)
2,453
Spin Rate (max)
2,367
Spin Rate (avg)
IVB (avg)
HM (max)
HM (avg)
Extension (avg)
Release Ht (avg)
Spin Score (max)
Zone %
Trackman - ChangeUp
80.7
Velocity (max)
78.3 - 80.7
Velo Range
77.9
Eff Velocity (avg)
2,129
Spin Rate (max)
2,056
Spin Rate (avg)
IVB (max)
IVB (avg)
HM (max)
HM (avg)
Extension (avg)
Release Ht (avg)
Spin Score (max)
Preseason All-State: Underclass (Invite-Only)
Feb 26, 2022
Trackman - Fastball
83.8
Velocity (max)
82.9 - 83.7
Velo Range
82.7
Eff Velocity (avg)
2,118
Spin Rate (max)
2,028
Spin Rate (avg)
IVB (max)
IVB (avg)
HM (max)
HM (avg)
Extension (avg)
Release Ht (avg)
Spin Score (max)
Zone %
Trackman - Curveball
70.2
Velocity (max)
67.3 - 69.4
Velo Range
67.1
Eff Velocity (avg)
2,406
Spin Rate (max)
2,305
Spin Rate (avg)
IVB (max)
IVB (avg)
HM (max)
HM (avg)
Extension (avg)
Release Ht (avg)
Spin Score (max)
Zone %
Trackman - ChangeUp
78.6
Velocity (max)
76.8 - 78.6
Velo Range
77.5
Eff Velocity (avg)
1,942
Spin Rate (max)
1,910
Spin Rate (avg)
IVB (max)
IVB (avg)
HM (max)
HM (avg)
Extension (avg)
Release Ht (avg)
Spin Score (max)
Zone %
Lockport Preseason ID
Feb 21, 2022
Trackman - Fastball
83.0
Velocity (max)
82.1 - 82.9
Velo Range
81.1
Eff Velocity (avg)
2,172
Spin Rate (max)
2,075
Spin Rate (avg)
IVB (max)
IVB (avg)
HM (max)
HM (avg)
Extension (avg)
Release Ht (avg)
Spin Score (max)
Zone %
Trackman - Curveball
66.2
Velocity (max)
65.4 - 66.2
Velo Range
63.6
Eff Velocity (avg)
2,334
Spin Rate (max)
2,268
Spin Rate (avg)
IVB (max)
IVB (avg)
HM (max)
HM (avg)
Extension (avg)
Release Ht (avg)
Spin Score (max)
Trackman - ChangeUp
76.4
Velocity (max)
73.0 - 76.0
Velo Range
72.6
Eff Velocity (avg)
1,951
Spin Rate (max)
1,886
Spin Rate (avg)
IVB (max)
IVB (avg)
HM (max)
HM (avg)
Extension (avg)
Release Ht (avg)
Spin Score (max)
Zone %
Underclass Showcase
Oct 17, 2021
Trackman - Fastball
79.2
Velocity (max)
78.2 - 79.1
Velo Range
76.8
Eff Velocity (avg)
1,913
Spin Rate (max)
1,858
Spin Rate (avg)
IVB (max)
IVB (avg)
HM (max)
HM (avg)
Extension (avg)
Release Ht (avg)
Spin Score (max)
Trackman - Curveball
66.6
Velocity (max)
62.0 - 65.7
Velo Range
62.4
Eff Velocity (avg)
2,172
Spin Rate (max)
2,083
Spin Rate (avg)
IVB (max)
IVB (avg)
HM (max)
HM (avg)
Extension (avg)
Release Ht (avg)
Spin Score (max)
Trackman - ChangeUp
75.8
Velocity (max)
73.4 - 75.6
Velo Range
73.1
Eff Velocity (avg)
1,918
Spin Rate (max)
1,820
Spin Rate (avg)
IVB (max)
IVB (avg)
HM (max)
HM (avg)
Extension (avg)
Release Ht (avg)
Spin Score (max)
Zone %
Pitch Scores
2021
Fastball
Hop+
A fastball with hop has a flat approach angle and visually jumps through the zone. When thrown up in the zone, it is more likely to generate a higher swing and miss average. Hop+ of 100 is MLB average.
Fastball
Sink+
A fastball with sink has low backspin and drops through the strike zone. When thrown down in the zone, it is more likely to generate a higher ground ball percentage and lower launch angle. Sink+ of 100 is MLB average.
Fastball
Rise+
A fastball with rise has a high percentage of backspin. When thrown up in the zone, it is more likely to generate a higher fly ball percentage. Rise+ of 100 is MLB average
Curveball
Hammer+
A hammer breaking ball drops vertically with velocity through the zone, or 12-to-6 movement. Hammer+ of 100 is MLB average.
Curveball
Sweep+
A sweeping breaking ball moves horizontally with velocity through the zone. Sweep+ of 100 is MLB average.
Pitching Velos
2024
2022
2021
Fastball
Velocity Max
The maximum observed fastball velocity in the given event year. Measured in miles per hour (MPH).
90.0
Fastball
Velocity Avg
The average velocity for all pitches of this type in the given event year. Measured in miles per hour (MPH)
88.0
Curveball
Velocity Avg
The average velocity for all pitches of this type in the given event year. Measured in miles per hour (MPH)
71.0
Fastball
Velocity Max
The maximum observed fastball velocity in the given event year. Measured in miles per hour (MPH).
87.0
Fastball
Velocity Avg
The average velocity for all pitches of this type in the given event year. Measured in miles per hour (MPH)
83.7
Curveball
Velocity Avg
The average velocity for all pitches of this type in the given event year. Measured in miles per hour (MPH)
67.5
Changeup
Velocity Avg
The average velocity for all pitches of this type in the given event year. Measured in miles per hour (MPH)
77.3
Fastball
Velocity Max
The maximum observed fastball velocity in the given event year. Measured in miles per hour (MPH).
79.0
Fastball
Velocity Avg
The average velocity for all pitches of this type in the given event year. Measured in miles per hour (MPH)
76.0
Curveball
Velocity Avg
The average velocity for all pitches of this type in the given event year. Measured in miles per hour (MPH)
63.7
Changeup
Velocity Avg
The average velocity for all pitches of this type in the given event year. Measured in miles per hour (MPH)
70.5
Game Performance

2024
2023
10 Yard Dash
The athlete's fastest 0-10-yard split time in the given event year. Measured in seconds.
1.74
30 Yard Dash
The athlete's fastest 0-30-yard split time in the given event year. Measured in seconds.
4.10
60 Yard Dash
The athlete's fastest 0-60-yard time in the given event year. Measured in seconds.
7.51
Top Speed (MPH)
The athlete's fastest split time converted to miles per hour.
Vertical Jump
A measure of any athlete's body strength and reach calculated from the flight time divided by the contact time.
10 Yard Dash
The athlete's fastest 0-10-yard split time in the given event year. Measured in seconds.
1.85
30 Yard Dash
The athlete's fastest 0-30-yard split time in the given event year. Measured in seconds.
4.26
60 Yard Dash
The athlete's fastest 0-60-yard time in the given event year. Measured in seconds.
7.74
Top Speed (MPH)
The athlete's fastest split time converted to miles per hour.
Vertical Jump
A measure of any athlete's body strength and reach calculated from the flight time divided by the contact time.
Preseason All-State: Underclass (Invite-Only)
Feb 25, 2023
Swift
1.85
10-yd
4.26
30-yd
7.74
60-yd
17.6
Run speed (max)
1,736
Jump Power (max)
27.3
Jump Height (max)
27.2
Jump Height (avg)
Illinois State Games (Invite-Only)
Aug 9, 2022
Swift
1.87
10-yd
4.31
30-yd
7.87
60-yd
17.3
Run speed (max)
7.6
Run Speed (avg)
1.60
RSi (max)
1.60
RSi (avg)
1,704
Jump Power (max)
26.7
Jump Height (max)
26.6
Jump Height (avg)
2022 PBR Future Games
Jul 27, 2022
Swift
1.90
10-yd
4.33
30-yd
7.79
60-yd
17.7
Run speed (max)
7.7
Run Speed (avg)
1.34
RSi (max)
1.34
RSi (avg)
1,728
Jump Power (max)
27.2
Jump Height (max)
26.9
Jump Height (avg)
Visual Edge

2024
2022
2021
Edge Score
The highest Edge Score within the given year. Edge Score is a comprehensive score that takes the core-six visual skills into account, providing an assessment of an athlete’s overall visual ability.
71.42
Edge Score
The highest Edge Score within the given year. Edge Score is a comprehensive score that takes the core-six visual skills into account, providing an assessment of an athlete’s overall visual ability.
74.6
Edge Score
The highest Edge Score within the given year. Edge Score is a comprehensive score that takes the core-six visual skills into account, providing an assessment of an athlete’s overall visual ability.
72.15
Pitch Ai

2022
Arm Speed
The maximum speed, in the direction of home plate, that the wrist is traveling. Measured in meters per second (m/s)
Arm Slot
Angle of the forearm relative to the ground between maximum external rotation (MER) and ball release (BR). Which can be a powerful player comparison metric, delivered in degrees.
Knee Extension Velo
The angular velocity of the front knee straightening after foot plant, which provides indicators of velocity potential. Measured in degrees per second.
Deception
The amount of time that the ball is visible to the hitter, after the instant of front foot strike. Measures in milliseconds.
Hip-Shoulder Separation
The difference in angle of between the hips and shoulders, occurring close to the foot plant. Measured in degrees.
Illinois State Games (Invite-Only)
Aug 9, 2022
ProPlayAI - Foot Plant
Elbow Flexion (avg)
Shoulder Abduction (avg)
Hip Shoulder Seperation (avg)
ProPlayAI - MER
External Rotation (avg)
Stride Length (avg)
Horizontal Abduction (avg)
ProPlayAI - Release
Arm Speed (max)
Arm Speed (avg)
Knee Extension Velocity (max)
Knee Extension Velocity (avg)
Knee Flexion (avg)
Arm Slot (avg)
Lateral Trunk Tilt (avg)
Arm Path (avg)
Deception (avg)
Torque (avg)
Efficiency (avg)
Sequencing (avg)
Preseason All-State: Underclass (Invite-Only)
Feb 26, 2022
ProPlayAI - Foot Plant
Elbow Flexion (avg)
Shoulder Abduction (avg)
Hip Shoulder Seperation (avg)
ProPlayAI - MER
External Rotation (avg)
Stride Length (avg)
Horizontal Abduction (avg)
ProPlayAI - Release
Arm Speed (max)
Arm Speed (avg)
Knee Extension Velocity (max)
Knee Extension Velocity (avg)
Knee Flexion (avg)
Arm Slot (avg)
Lateral Trunk Tilt (avg)
Arm Path (avg)
Deception (avg)
Torque (avg)
Efficiency (avg)
Sequencing (avg)
Lockport Preseason ID
Feb 21, 2022
ProPlayAI - Foot Plant
Elbow Flexion (avg)
Shoulder Abduction (avg)
Hip Shoulder Seperation (avg)
ProPlayAI - MER
External Rotation (avg)
Stride Length (avg)
Horizontal Abduction (avg)
ProPlayAI - Release
Arm Speed (max)
Arm Speed (avg)
Knee Extension Velocity (max)
Knee Extension Velocity (avg)
Knee Flexion (avg)
Arm Slot (avg)
Lateral Trunk Tilt (avg)
Arm Path (avg)
Deception (avg)
Torque (avg)
Efficiency (avg)
Sequencing (avg)
Notes
News
- Illinois State Games: Class of 2025 Infield Analysis - Nov 1, 2024
- Illinois State Games: Class of 2025 Catcher Analysis - Oct 28, 2024
- Illinois State Games: 2025 Takeaways - Aug 21, 2024
- Rock Summer Championship 17U: Takeaways - Aug 1, 2024
- Illinois Scout Blog: 3A/4A State Finals - Jun 17, 2024
- Final Illinois Power 25 Team Rankings - Jun 10, 2024
- Illinois 2025 Rankings: Updated - May 22, 2024
- Week 6 Games - Apr 23, 2024
- Illinois 2025 Rankings Updated - Mar 27, 2024
- Preseason Power 25 Countdown: No. 3 Providence Catholic - Mar 11, 2024
- 2024 Preseason All-State, Upperclass: Takeaways - Feb 29, 2024
- 2024 Preseason All-State, Upperclass: Data Dive - Feb 29, 2024
- Illinois 2025 Rankings: Update - Nov 29, 2023
- Illinois 2025 Rankings: Update - Aug 30, 2023
- 2023 PBR Illinois Second Team All-State - Jun 21, 2023
- Preseason All-State Underclass: Top Overall Prospects - May 19, 2023
- Preseason All-State Underclass: Infield Analysis - May 18, 2023
- Illinois 2025 Rankings Updated - May 17, 2023
- Preseason All-State Underclass: Catcher Analysis - May 15, 2023
- Week 7 Games - May 5, 2023
- Week 4 Games - Apr 12, 2023
- Preseason Power 25 Countdown: No. 11 Providence Catholic - Mar 10, 2023
- Preseason All State, Underclass: Quick Hits - Mar 1, 2023
- Preseason All-State, Underclass: Preview - Feb 23, 2023
- Lockport Preseason ID: Preview - Feb 17, 2023
- Top-10 Stories of 2022: No. 10 Team Illinois Goes Undefeated at PBR Future Games - Dec 19, 2022
- Dandy Dozen: 12 Uncommitted '25 Names to Know - Dec 15, 2022
- PBR Illinois 2023 Winter Showcase Calendar: Release - Nov 9, 2022
- PBR Future Games: Statistical Analysis - Sep 1, 2022
- Illinois Class of 2025 Rankings Update - Aug 31, 2022
- Illinois State Games: Takeaways - Aug 15, 2022
- Illinois State Games: Roster Preview - Aug 4, 2022
- Future Games: Team Illinois Game 2 Recap - Jul 29, 2022
- Future Games: Team Illinois Game 1 Recap - Jul 28, 2022
- PBR Future Games: Team Illinois Preview - Jul 20, 2022
- Preseason All-State Underclass: Infield Analysis - Jul 7, 2022
- Preseason All-State Underclass: Pitcher Analysis - Jul 7, 2022
- Preseason All-State Underclass: Top Overall - Jul 7, 2022
- Preseason All-State Underclass: Catcher Analysis - Jun 22, 2022
- Lockport Preseason ID: Pitcher Analysis - Jun 14, 2022
- Lockport Preseason ID: Top Overall Prospects - Jun 14, 2022
- Illinois Class of 2025 Rankings: First Look - Jun 10, 2022
- Lockport Preseason ID: Infield Analysis - Jun 5, 2022
- Lockport Preseason ID: Catcher Analysis - Jun 1, 2022
- Week 7 Games - May 11, 2022
- Underclass Showcase: Top Overall Prospects - Mar 31, 2022
- Underclass Showcase: Infield Analysis - Mar 29, 2022
- Underclass Showcase: Pitcher Analysis - Mar 29, 2022
- Underclass Showcase: Catcher Analysis - Mar 7, 2022
- Preseason All-State: Underclass TrackMan Files - Mar 3, 2022
- Preseason All-State: Underclass Statistical Analysis - Mar 2, 2022
- Preseason All-State: Underclass Quick Hits - Mar 1, 2022
- Lockport Preseason ID: Statistical Analysis - Feb 25, 2022
- Lockport Preseason ID: TrackMan Files - Feb 25, 2022
- IL Preseason All-State - Underclass: Preview - Feb 25, 2022
- Lockport Preseason ID: Quick Hits - Feb 24, 2022
- Lockport Preseason ID: Preview - Feb 17, 2022
- Underclass Showcase: Statistical Analysis - Oct 20, 2021
- Underclass Showcase: Quick Hits - Oct 19, 2021
- Underclass Showcase: Preview Story - Oct 14, 2021
- Lockport Future Prospects Showcase: Player Analysis - Aug 17, 2021
- Future Prospects Showcase - The MAX: Analysis - May 29, 2020
Comments
Draft Reports
Contact
Premium Content Area
To unlock contact information, you need to purchase a ScoutPLUS subscription.
Purchase Subscription OR
Login
Physical
2024
Grip Strgth (LH)
Grip strength is a measure of a players bat control and ability to transfer power and speed during impact, measured in pounds of force generated; collected with elbow bent at 90 degrees.
Grip Strgth (RH)
Grip strength is a measure of a players bat control and ability to transfer power and speed during impact, measured in pounds of force generated; collected with elbow bent at 90 degrees.


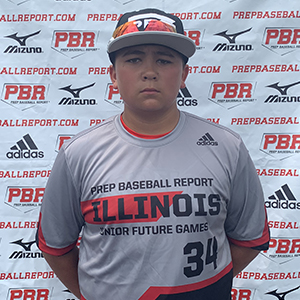






 Sign in to view rankings
All C/INF Enzo Infelise (Providence Catholic; Oklahoma commit) has done since we first saw him is hit. The 6-foot-2, 229-pound right-handed hitter has easy strength in his bat, juicing a no-doubt home run over the left field wall during game play. He continues to show well above-average bat-to-ball skills, making it hard for pitchers to get a strike past him. He had one of the more impressive rounds of batting practice during the event’s showcase, barreling balls for an average exit velocity of 94.4 mph (T102.4 mph), while sending his farthest hit ball 356 feet, per TrackMan. Infelise’s average bat speed was 74.4 mph, including an average hand speed of 22 mph. Defensively from the crouch, he recorded an 81 mph catcher velocity while recording a pop time range of 1.87-1.95, also tallying 88 mph across the diamond during infield defense.
Positional Profile: C/3B
Body: 6-2, 229-pounds.
Hit: RHH. Tall, open setup, small leg lift with short stride. Direct, quick path, above-average bat-to-ball, all fields approach. 74.3 mph bat speed with 16 G’s of rotational acceleration.
Power: 102 max exit velocity, averaged 94.4 mph. 356’ max distance.
Arm: RH. C - 81 mph. INF - 88 mph. Quick action, long arm swing, 3/4 slot.
Defense: 1.87-1.95 pop times. INF: Steady hands that work out front, deliberate footwork. C: Quick mover, upright upper body, low transfer.
Run: 7.51 runner in the 60.
Positional Profile: C/3B
Body: 6-2, 229-pounds.
Hit: RHH. Tall, open setup, small leg lift with short stride. Direct, quick path, above-average bat-to-ball, all fields approach. 74.3 mph bat speed with 16 G’s of rotational acceleration. Finished gameplay 2-for-5 with a home run, triple, two runs scored, two walks and a stolen base.
Power: 102 max exit velocity, averaged 94.4 mph. 356’ max distance.
Arm: RH. C - 81 mph. INF - 88 mph. Quick action, long arm swing, 3/4 slot.
Defense: 1.87-1.95 pop times. INF: Steady hands that work out front, deliberate footwork. C: Quick mover, upright upper body, low transfer.
Run: 7.51 runner in the 60.
C Enzo Infelise (Providence Catholic, 2025) Oklahoma commit. Infelise continues to impress in front of our staff at the plate, showing minimal swing-and-miss from the right-side, and consistently producing well-hit line drives to all fields. He finished the day with two hits, one being a line drive to the left-field fence for a double.
Oklahoma commit. Currently ranked No. 8 in the state’s 2025 class (No. 262 overall). Stands in a strong frame at 6-foot-2, 229-pounds. Started at third base and batted lead off for the Celtics. The right-handed hitter showed confidence at the plate with a mature approach, was a tough out for opposing pitchers with his advanced bat-to-ball skills and ability to put the ball in play with hard contact if he finds a pitch in the zone; Well above-average bat speed with easy power. Finished Friday 1-for-2 with two walks. Defensively, showed the ability to make the routine play; also displayed a strong arm across the diamond. One of the top prospects in Illinois’ to-be senior class. Infelise continued to swing a hot bat on Saturday night in the State Championship game; notching two more hits out of the leadoff spot for the Celtics. What stood out the most from Infelise’s performance on Saturday was how each time up at the plate he seemingly found the barrel and hit everything hard, even when he made his lone out of the game. With his feel to hit and knack for finding the barrel, Infelise remains one of the top bats in the state moving forward.
Oklahoma commit, currently ranked No. 6 in the state; No. 240 nationally. The imposing 6-foot-2, 229-pound Infelise is another Celtic that had a solid showing Thursday on both offense and defense. Defensively it was a quiet day for him behind the plate until later in the game, where he got to show off his arm strength to back-pick a runner in between second and third base. Offensively he swings a heavy barrel from the right side and went 1-for-4 with an RBI out of the two-spot in the lineup. Infelise is a high-profile junior to continue to follow throughout the spring.
C/3B Enzo Infelise (Providence Catholic, 2025; Oklahoma commit) continues to produce some of the louder batted ball data in the Illinois’ junior class. Infelise led the entire event with the highest average exit velocity (98.4 mph) and he hit seven balls at 97 mph or higher throughout his round. Additionally, Infelise had five different barrels check in at 100+ mph, including his hardest batted ball at 101.4 mph. Defensively, Infelise led all catchers in peak throwing velocity (T83 mph) and pop times (1.86-1.91) while also tying for the event lead in max infield velocity (T90 mph).
C/INF Enzo Infelise (Providence Catholic; Oklahoma commit) continues to put his impressive hit tool on display, currently slotted at No. 7 in the state, No. 240 nationally. Listed at 6-foot-1, 229-pounds with a strong, durable frame, the right-handed hitter punished baseballs throughout his round; averaging 98.4 mph for his EV with a max of 101.4 mph, recording every ball he hit over 95 mph. He has fluid hands that allows him to remain on-time, and he has mature feel to hit to the whole field with extension through the zone. On the infield, Infelise boasts soft hands that play through the ball, moving well for his size laterally. His arm is plenty strong, playing from an over-the-top release with carry at 90 mph. He’s continued to trend up behind the plate, working with a clean glove-to-hand transfer while gaining ground on throws to second, creating a pop-time as low as 1.86 with a top velocity of 83 mph, playing with clear life and carry to the bag.
Oklahoma commit, 1B Enzo Infelise (Providence Catholic, 2025) was his usual self this weekend in Rantoul. Currently ranked No. 6 in Illinois’ 2025 class, the right-handed hitter was a tough out for opposing pitchers. He has a fluid weight-shift load before exploding into contact with a quick, slightly uphill path. Infelise produced a plethora of loud contact throughout, recording multiple extra-base-hits on balls to the gaps. Continues to show why he’s one of the top prospects in the state, regardless of class with his hit tool.
C Enzo Infelise (Providence Catholic, 2025; Oklahoma commit) continues to cement himself as one of the premier right-handed hitters in the midwest’s 2025 class. The 2022 PBR Future Games alum swings a heavy barrel and has the ability to hit the ball to all fields with authority. In yet another look at one of the top-ranked juniors in the state, his bat speed and feel for the barrel shined once again.He recorded multiple extra-base hits on the weekend, a double to the pull-side gap on Saturday and a double to the back-side gap the following day.
An Oklahoma signee, Infelise solidified himself as one of the top backstops in the Class of 2025 after turning in an impressive spring en route to being named the Chicago Catholic League Blue Player of the Year. The IHSBCA Class 4A All-State selection turned-in a .525/.636/.717 slash line with two home runs, 35 RBI’s, 13 doubles and 52 hits against a tough slate of opponents, and was an anchor for a Providence Catholic squad that finished with a 30-7-1 overall record. Infelise also continued to show his prowess behind the plate, registering a .984 fielding percentage on the season.
Oklahoma commit. Currently ranked No. 5 in the state, No. 309 nationally. Infelise continues to have an impressive sophomore season as he got the start behind the plate and batted third in the lineup. Saw a total of seven pitches and made contact on five of five swings. Collected three more hits in the game against St. Laurence. The first at-bat he was ready and on time for a first-pitch fastball hitting a solid one hop through the left side of the infield. His third at-bat nearly missed an opposite field home run, instead a two RBI double. Continues to show why he is one of the top Sophomores in the state.
Oklahoma commit, currently ranked No. 5 in the Illinois’ 2025 class and No. 309 Nationally. 6-foot-2, 205-pound, mature, strong build with strength in the lower half. HIt in the two-hole and caught. Continues to establish himself as one of, if not the top, right-handed hitter in the class. Finished 2-for-4 with two RBIs. Took a chest high fastball and stayed on it, lining a run-scoring single off of the center field wall in his first at-bat. Also, grounded an RBI single through the left-side in his second at-bat. Calm and confident overall demeanor in the box, does not get cheated, is ready to hit with above-average bat-to-ball skills and advanced bat strength. Defensively, flashes a big arm behind the plate that he showed off in the bottom of the first inning, throwing out a potential base stealer with a strong, accurate, true throw on the bag. Talented sophomore who continues to show a knack for hard in-game contact.
C Enzo Infelise (Providence Catholic, 2025) was one of two 2025 position players on last year’s Team Illinois Future Games squad and he continues to wield one of the top right-handed bats in the state. Infelise, who takes mature in-game at-bats with all kinds of confidence and presence in the box, continues to elevate his power profile, leading the event with a 385’ max batted ball with a T101.5 mph exit velocity and 91.6 mph average. On top of that, Infelise showed off a well-rounded game, looking the part behind the plate with quick, clean glove-to-hand release behind the plate while topping at 82 mph from out of the crouch, three mph harder than our last look. Yet another highly-impressive look at the uncommitted 2025.
C Enzo Infelise (Providence Catholic, 2025) was one of two 2025 position players on last year’s Team Illinois Future Games squad and he continues to wield one of the top right-handed bats in the state. Infelise, who takes mature in-game at-bats with all kinds of confidence and presence in the box, continues to elevate his power profile, leading the event with a 385’ max batted ball with a T101.5 mph exit velocity and 91.6 mph average. On top of that, Infelise showed off a well-rounded game, looking the part behind the plate with quick, clean glove-to-hand release behind the plate while topping at 82 mph from out of the crouch, three mph harder than our last look. Yet another highly-impressive look at the uncommitted 2025.
Positional Profile: C/3B
Body: 6-2, 205-pounds.
Hit: RHH. Tall open stance, slight leg kick, minimal hand load. Advanced bat speed, controlled intent, on the barrel with authority throughout, power bat profile.
Power: 101 max exit velocity, averaged 91.6 mph. 385’ max distance.
Arm: RH. C - 82 mph. INF - 90 mph. Short compact arm stroke, high 3/4 finish. Advanced arm strength for age from behind the plate and across the infield.
Defense: 1.90-2.02 pop times. Took reps behind the plate and on the infield. As a catcher, starts on one knee and creates momentum towards target with a clean exchange to release. On the infield, plays low to the ground and gathers out front, steady glovework, slight pack to release.
Run: 7.74 runner in the 60.
C Enzo Infelise (Providence Catholic, 2025) showed well as one of the younger prospects at this year’s Future Games and continued to back it up at the State Games. Infelise has a strong frame and his right-handed bat fits the mold of a middle-of-the-order bat moving forward. He is rarely off balance and off the barrel as he covers the whole plate and can drive the ball with authority to all fields. Defensively, he is developing behind the plate but has the tools to stick back there including a big arm that plays with life when it syncs up. High-follow 2025 in the state.
Positional Profile: C/3B
Body: 6-2, 190-pounds. Strong, broad-shouldered frame.
Delivery: Short leg-lift into balance point, tall/fall lower-half down the mound, shoulders remain level down the mound with a stride that works in-line to the plate, closed landing foot. In-game stats: 1 IP, 2 BB, K, 0 H, 0 R
Arm Action: RH. Long out of the glove into a high 3/4 slot, quick arm to release.
FB: T86.7, 84-86 mph. Finish through the zone with life. T2289, 2196 average rpm.
CB: 68-70 mph. Sharp downer action, feel for the zone. T2453, 2367 average rpm.
CH: 78-81 mph. Fades to the arm-side. T2129, 2056 average rpm.
Positional Profile: C/3B
Body: 6-2, 190-pounds. Strong, broad-shouldered frame.
Hits: RHH. Balanced, slightly open setup, fluid load and rhythm throughout. Controlled aggression, intent and moxy in the box. Short path, creates advanced bat speed for his age and looks to drive the baseball with authority to all fields.
Power: 95 max exit velocity, averaged 82.3 MPH. 312' max distance.
Arm: RH. C-78 mph. Loose, quick, athletic arm, plays strong and over-the-top.
Defense: 1.85-1.94 pop times. Quiet hands, quick feet and advanced glove-to-hand transfer.
Run: 7.87 runner in the 60.
Vizual Edge: 74.6 Edge Score
Positional Profile: C/3B
Body: 6-2, 190-pounds. Strong, broad-shouldered frame.
Delivery: Short leg-lift into balance point, tall/fall lower-half down the mound, shoulders remain level down the mound with a stride that works in-line to the plate, closed landing foot. In-game stats: 1 IP, 2 BB, K, 0 H, 0 R
Arm Action: RH. Long out of the glove into a high 3/4 slot, quick arm to release.
FB: T86.7, 84-86 mph. Finish through the zone with life. T2289, 2196 average rpm.
CB: 68-70 mph. Sharp downer action, feel for the zone. T2453, 2367 average rpm.
CH: 78-81 mph. Fades to the arm-side. T2129, 2056 average rpm.
Positional Profile: C/3B
Body: 6-2, 190-pounds. Strong, broad-shouldered frame.
Hits: RHH. Balanced, slightly open setup, fluid load and rhythm throughout. Controlled aggression, intent and moxy in the box. Short path, creates advanced bat speed for his age and looks to drive the baseball with authority to all fields.
Power: 95 max exit velocity, averaged 82.3 MPH. 312' max distance.
Arm: RH. C-78 mph. Loose, quick, athletic arm, plays strong and over-the-top.
Defense: 1.85-1.94 pop times. Quiet hands, quick feet and advanced glove-to-hand transfer.
Run: 7.87 runner in the 60.
Vizual Edge: 74.6 Edge Score
Has shown well in multiple looks in the past, including the 2021 Junior Future Games. Strong build, listed at 6-foot, 190-pounds. Right-handed hitter got the start behind the plate and batted fifth. Balance stance, arm bar pre-pitch, smooth toe tap stride. Strong hands, advanced bat speed for age, short and direct to the ball, powerful swing; pull side, gap-to-gap approach. Defensively behind the plate, quiet receiver with soft, receptive hands. Tall, athletic setup with runners on, quick transfer with athletic feet. Threw out a runner taking third base to complete a strike out/throw out to end the third inning.
Positional Profile: 3B/1B
Body: 6-0, 190-pounds. Lean strength throughout.
Hit: RHH. Tall, balanced setup. Front leg open, some pre-pitch looseness/rhythm. Loose, athletic hands. Strong, aggressive swing. Lifted contact. Advanced jump off the barrel for his age.
Power: 97.4 max exit velocity, averaged 84.1 mph. 345’ max distance.
Arm: RH. C - 74 mph. INF - 84 mph. C: Loose arm action. High 3/4 arm slot. Flashed accuracy on throws to second. INF: Loose, strong arm. Plays from a high 3/4 slot with easy life out of the hand, carry across the diamond.
Defense: 2.02-2.12 pop times. C: Agile. Soft hands, quick exchange. Inf: Plays loose. Under control on the move. Balanced footwork.
Run: 8.04 runner in the 60.
Positional Profile: RHP
Delivery: Max effort delivery, works toward first base side, closed toe landing on ball of foot.
Arm Action: RH. Over-the-top slot, works with some length, above average arm speed.
FB: T83.8, 82.9-83.7 mph. Plays straight, four seam type, showed some carry through the zone. T2118, 2027 average rpm.
CB: 67.3-69.4 mph. 11/5 shape, showed some depth. T2406, 2305 average rpm.
CH: 76.8-78.6 mph. Fades to arm side from a lower slot. T1941, 1910 average rpm.
Infelise has advanced bat strength for his age, and he swings with a purpose, routinely driving balls with authority into both gaps. Infelise also has advanced arm strength, running it up to 84 mph across the infield and on the mound.
Positional Profile: 3B/1B/RHP
Body: 6-0, 190-pounds. Physical frame for age.
Delivery: Deliberate, controlled, tall and fall type delivery. Lands front toe closed. Falls off to first base side.
Arm Action: RH. Long, loose arm action. Works from a high 3/4 arm slot.
FB: T83, 82.1-82.9 mph. Straight, four-seam, efficient backspin; above-average carry for age. T2172, 2074 average rpm.
CB: 65.4-66.2 mph. Projects; spin feel, flashed bite, and complements fastball shape. T2334, 2267 average rpm.
CH: 73.0-76.0 mph. Mostly maintains arm speed; aggressive. T1950, 1885 average rpm.
Hit: RHH. Balanced setup, hands start straight back, short stride. Swings with intent, uphill to contact, loud off the barrel and looks to elevate, gap-to-gap approach.
Power: 98.3 max exit velocity, averaged 89.4 mph. 324’ max distance.
Arm: RH. C - 73 mph. INF - 83 mph. Short, quick arm action, high 3/4 slot. Throws play accurate with life.
Defense: Took reps at both catcher and the infield.Tall setup behind the plate, gains ground to second, quick exchange. Soft footwork in the infield, soft hands, works through the center of the body.
Run: 7.99 runner in the 60.
It was another loud showing from C/INF/RHP Enzo Infelise (Providence Catholic, 2025), as the former PBR Junior Future Games participant continues to look the part as one of the more physical right-handed hitters in the state’s 2025 class. Built at a leaner and stronger 6-foot-2, 190-pounds, Infelise attacked the pull-side gap with hard contact throughout BP. His 98.3 mph max exit velocity was amongst the event’s best and it’s an especially noticeable mark for someone of his age. Infelise’s ability to elevate the baseball on the barrel stood out, as he recorded an average exit velocity of 89.4 mph and average batted distance of 262 feet - both of which are above-average batted ball metrics for his age. As a catcher, Infelise showed an elite catch and release skill set behind the plate. His pop times were consistently in the 2.00 - 2.03 range. He has a very direct and fast catch and release mechanic. His armplays strong from a short over the top arm slot. His footwork is advanced, he understands the importance of using his feet to set up his throws to second base. On the infield he continued to show advanced feel and arm strength for his age. Naturally, his arm strength works on the mound, too, where he reached an 83.0 mph high with a fastball featuring efficient backspin and carry traits, and he demonstrated authentic spin feel with his breaking ball. Enzo is a projectable 2025 and a high-follow freshman to know in Illinois.
Positional Profile: 3B/1B/RHP
Body: 6-0, 190-pounds. Thick, strong build with strength throughout.
Delivery: Smooth, fluid tall and fall delivery, lands open, effort throughout.
Arm Action: RH.
FB: T79.2, 78.25-79.10 mph. Lively out of hand, plays straight, thrown for strikes. T1913, 1857 average rpm.
CB: 62.00-65.68 mph. 11/5 shape. T2172, 2082 average rpm.
CH: 73.39-75.58 mph. Thrown with fastball arm speed, late fade. T1917, 1820 average rpm.
Hit: RHH. Athletic setup, knee-knocks into a long stride. Loose arms with bat speed through the zone, uphill path with natural lift, explosive hands.
Power: 90.93 max exit velocity, averaged 88.37 mph. 341’ max distance.
Arm: RH. C - 74 mph. INF - 81 mph. From behind the plate; short over-the-top slot, quick arm, throws have carry. From the infield; loose, high 3/4 slot.
Defense: 2.00 - 2.01 pop times. From behind the plate; soft hands, quick transfer with athletic feet out of the crouch. From the infield; sure-handed, moves well for size.
Run: 8.50 runner in the 60.
Positional Profile: CIF/RHP
Body: 6-0, 180-pounds. Strong, durable build.
Defense: Steady hands, clean exchanges, plays through the ball at times.
Arm: RH. INF - 78 mph. Short arm action, high 3/4 arm slot, flashes arm strength.
Hit: RHH. Balanced setup, toe-tap trigger, short stride, easy pre-pitch actions. Aggressive, short swing, level bat path, used the entire field with line drives, ball jumps off barrel.
Power: 84 mph exit velocity from the tee.
Delivery: Tall and fall delivery, slow, rhythmic tempo, shoulders work slightly uphill, lands square, works in line with target.
Arm Action: RH. Long, loose arm action, high 3/4 arm slot.
FB: T75, 73-75 mph. Heavy ball for his age, plays downhill, strikes.
CB: 59-63 mph.11/5 shape, advanced sharp action, depth.
CH: 66-68 mph. Arm side fade, located down in the zone.
Positional Profile: C/3B
Body: 5-9, 155-pounds.
Defense: Soft hands, clean transfer with a quick release, third base profile.
Arm: RH. INF - 66 mph. Long and loose arm action, 3/4 slot.
Hit: RH. Open setup, simple load, long stride. Long and level path, gap-to-gap approach.
Power: 75 mph exit velocity from the tee.